
FIGURE 4.
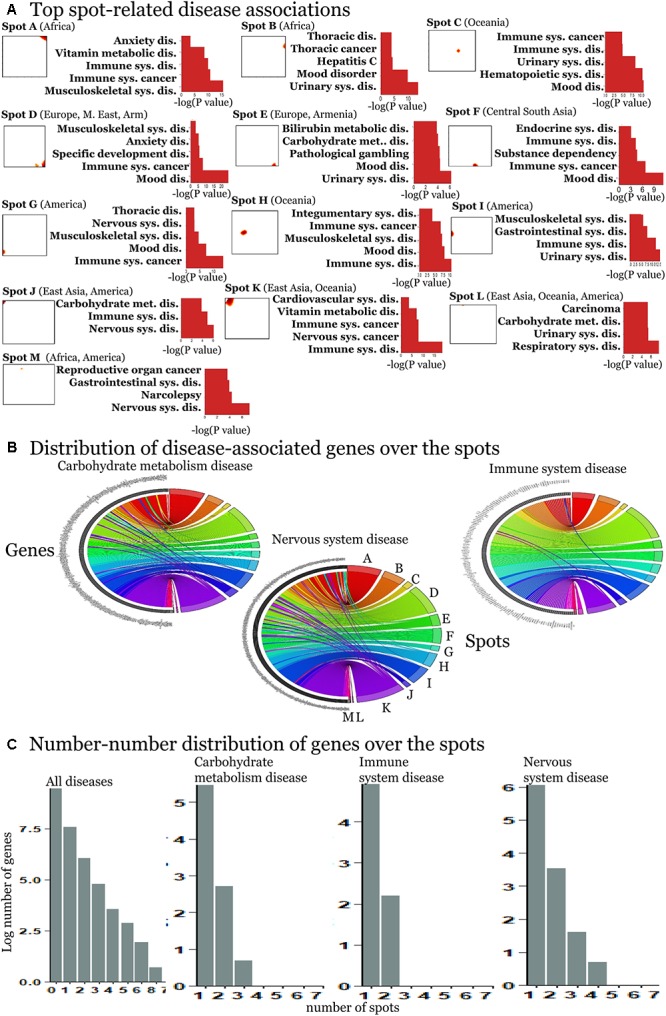
Spot-enrichment of disease-associated SNPs. (A) Top enriched disease terms in each of the spots (see Supplementary Figures S7–S19 for full lists of enriched diseases and Supplementary Figures S5, S6 for their background distribution). Enrichment p-values are obtained using Fishers exact test. (B) The circular plots link genes with spot-clusters containing SNPs referring to these genes. Each circular plot shows SNPs which associate with one disease. Different genes which associate with the same disease distribute over different spots. Genes specifically accumulate in the spots in a one-to-one fashion as a rule of thumb. Only a few genes were found in two or more spots according to different SNPs in the same gene (e.g., SH2B3). Examples were shown for three selected disease classes. (C) The number–number distributions over the spots follow an exponential decay meaning that the majority of genes associates with a single spot.