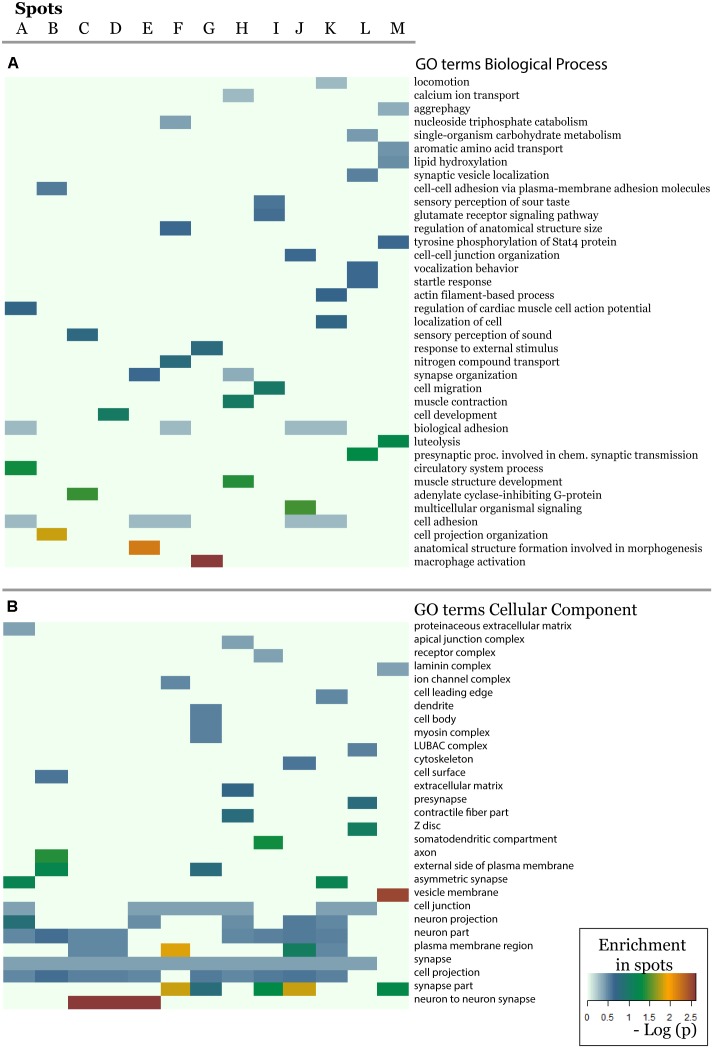
FIGURE 5.
The biological context of the spots is estimated by means of enrichment analysis using the GO terms (A) biological process and (B) cellular component. Enrichment p-values (Fisher’s exact test) were visualized as heatmap. One sees that, e.g., GO-terms related to neuronal function are enriched in most of spots but especially in spots showing minor allele preference in Europeans.

