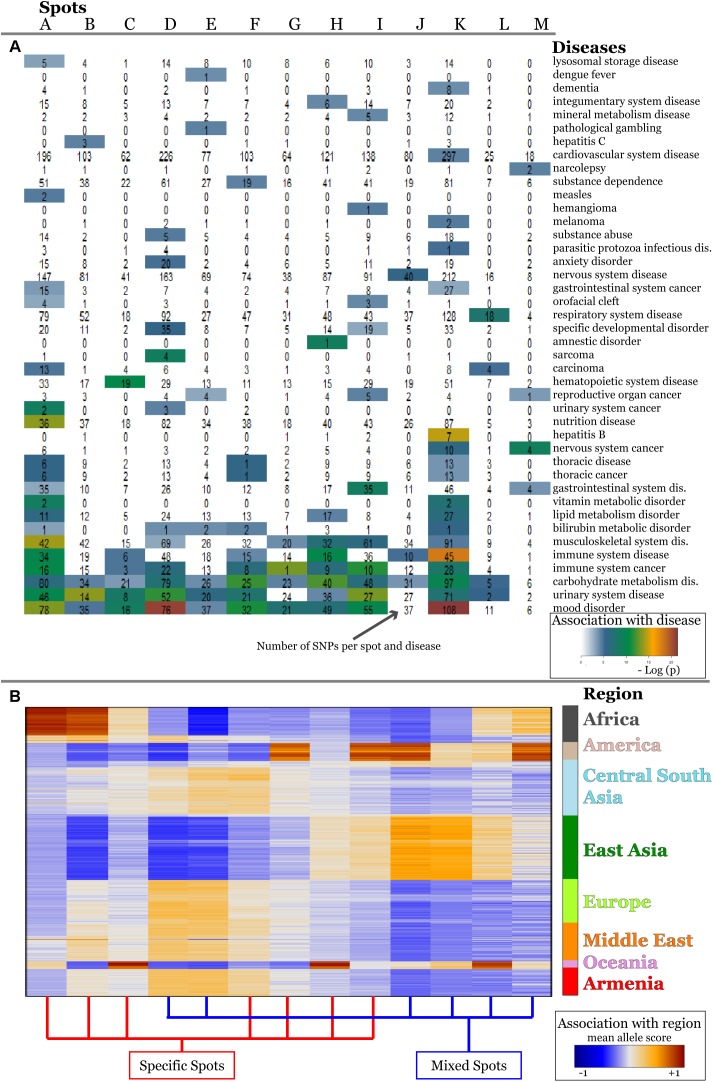
FIGURE 6.
Associations of spots with diseases (A) and with geographic regions (B) are shown as heatmaps. Diseases represented with high numbers of SNPs in the background distribution accumulate in the lower part of the heatmap (A). More rarely-presented diseases frequently associate with one or two spots only (A) which, in turn, are assigned to specific regions according to the respective mean allele score (B). SNPs associated with mood disorders are enriched in spots having high MAF in Europeans and East Asians which corresponds to the enrichment of GO-terms related to neuronal functions in Figure 5.

