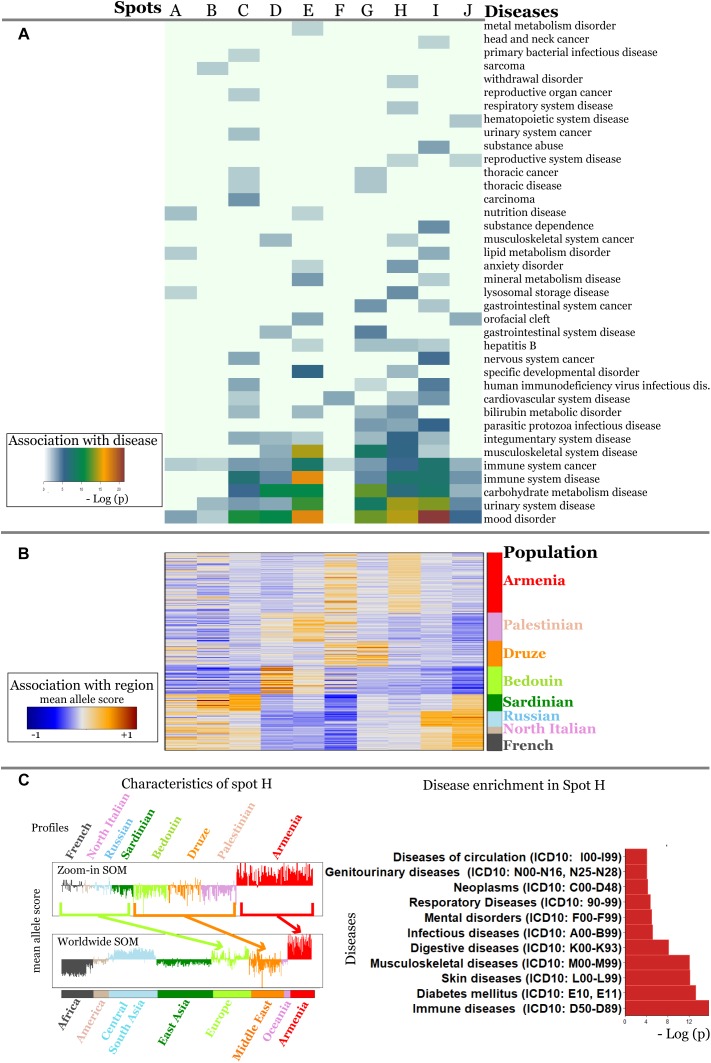
FIGURE 7.
Zoom-in analysis of selected populations from Europe and Middle East and of Armenians resolve geographic specifics of association between SNPs and disease risks with higher resolution. (A) Spot enrichment of diseases and (B) of minor allele scores are shown as heatmaps. Notably, spot H collects SNPs which suggest specifically increased disease risks in Armenians. (C) Profiles of spot H in the zoom-in and the world-wide SOM indicate specifically increased MAF of the included SNPs for Armenians. Top diseases which associate with spot H are shown as barplot of enrichment p-values.

