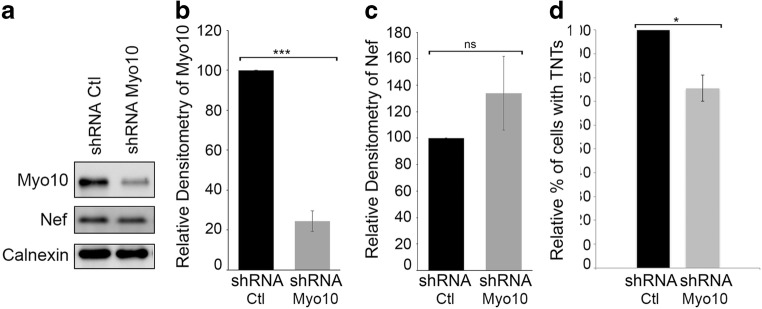
Fig. 2. Myo10 down-regulation in N5 doesn’t affect Nef expression but reduces TNT formation.
(a) Western blot analyses of Myo10 and Nef levels in N5-shRNA control cells versus N5-shRNA Myo10 cells. Calnexin was used as a loading control. Blot is a representative of 3 independent experiments. Densitometry representation of Myo10 (b) or Nef expression (c) are plotted. Graphs show the means (± s.e.m), with a P value <0.0001 (***). (d) Quantification of the number of cells with TNTs in N5-shRNA control cells versus N5-shRNA Myo10 cells. Down-regulation of Myo10 results in a decrease in TNT formation, independently of Nef expression. The graph shows the means (± s.e.m), with a P value <0.05 (*)

