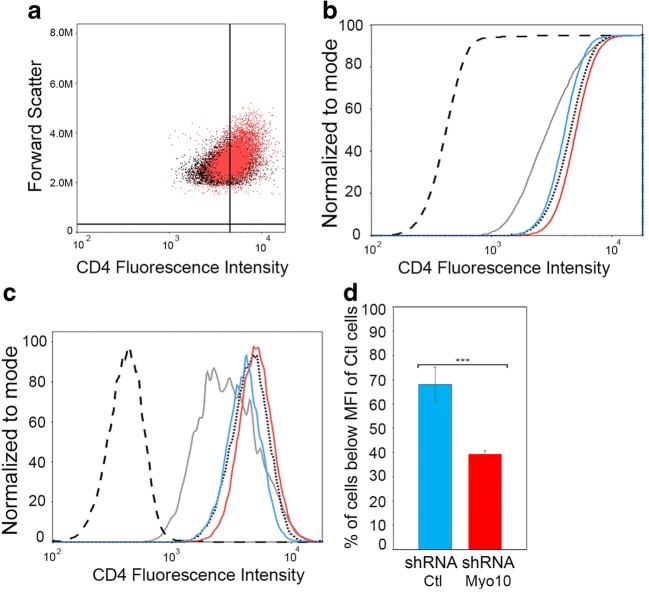
Fig. 6. Myo10 down-regulation in N5 doesn’t affect Nef expression but reduces Nef transfer.
(a) CEM-T4 were mixed in a 1 to 3 ratio with N5 shRNA Ctl cells or with N5 shRNA Myo10 cells. Representative 2-D scatter plots of the CD4 fluorescence intensity (log scale) in CEM-T4 mixed with N5 shRNA Myo10 cells (red) vs shRNA control cells (black). A slight upward shift in CD4 fluorescence intensity can be observed. Change in CD4+ mean fluorescence intensity (MFI) of CEM-T4 cells co-cultured with N5-shRNA control cells versus N5-shRNA Myo10 cells. Representative CDF (b) and histogram (c) views are plotted. Dashed, dotted, and gray lines are the same as in Figs. 4 and 5; red lines are CEMT4 cells co-cultured with N5-shRNA Myo10 cells and blue lines are CEMT4 cells co-cultured with N5-shRNA control cells (scramble shRNA). (d) Graphical representation plotting the percent of CEM-T4 cells with a Mean Fluorescence Intensity (MFI) below that of control cells (CD4 labeled CEM-T4) from 3 independent flow cytometry experiments. The increase of cells below MFI of control cells observed in Fig. 4 can be significantly reversed by knockdown of Myo10. Flow cytometry data was the average of 5 independent experiments. The graph shows the means (± s.e.m), with a P value <0.001 (***)

