Figure 5.
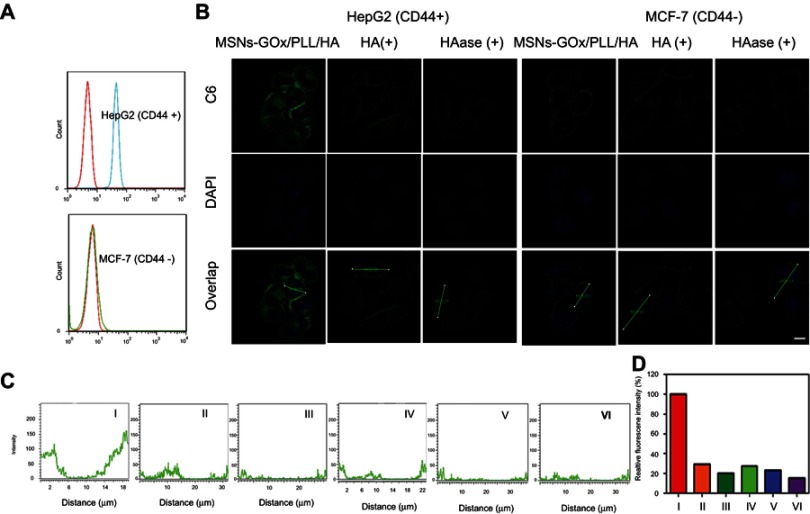
(A) The CD44 expression levels of HepG2 and MCF-7 cells were determined by flow cytometry. (B) The CD44-specific uptake in HepG2 and MCF-7 cells and (C) Z-line fluorescence intensity of C6 were determined by confocal laser scanning microscopy (Scale bar: 10 μm). The distances are indicated by the green lines in (B). (D) Relative fluorescence intensity based on (C); I: HepG2 (MSNs-GOx/PLL/HA), II: HepG2 (blocked), III: HepG2 (HAase), IV: MCF-7 (MSNs-GOx/PLL/HA), V: MCF-7 (blocked), VI: MCF-7 (HAase).
Abbreviations: MSNs, mesoporous silica nanoparticles; GOx, glucose oxidase; PLL, poly (L-lysine); HA, hyaluronic acid; HAase, hyaluronidase; C6, coumarin.

