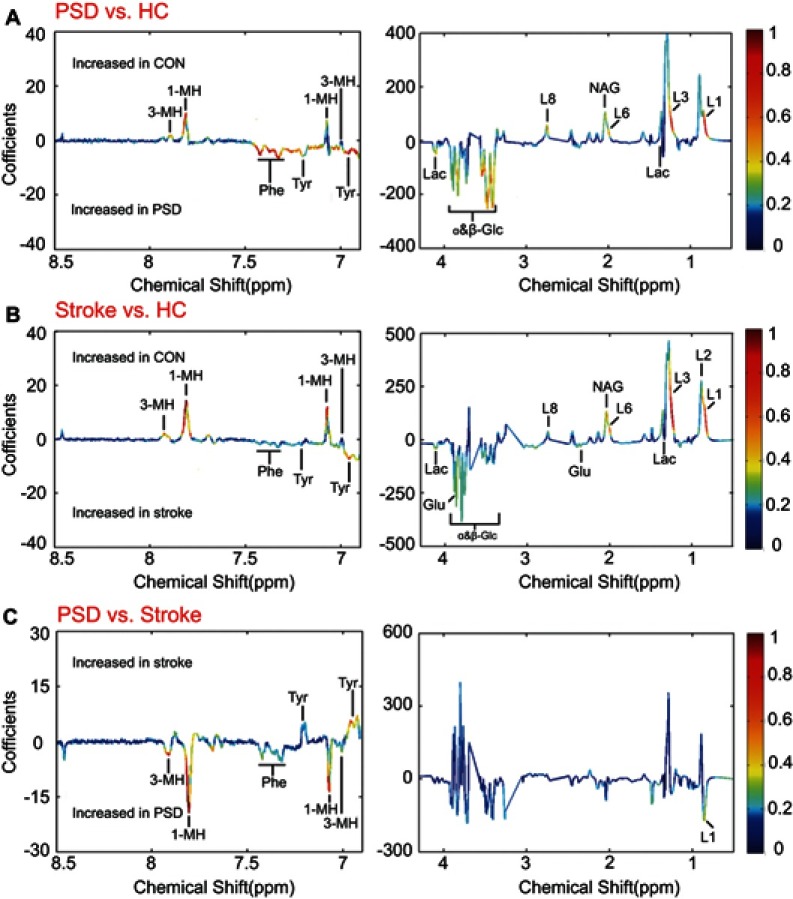
Figure 4.
Identification of differential metabolites responsible for discrimination among PSD, stroke and healthy comparison groups. (A and B) The loading coefficient plots of the OPLS-DA models show metabolite variations attributable to distinguishing the PSD group from the stroke and healthy comparison groups; (C) The plasma metabolites responsible for discrimination between stroke and healthy comparison subjects.Abbreviations: HC, healthy comparison; OPLS-DA, orthogonal partial least-squares discriminant analysis; PSD, post-stroke depression.

