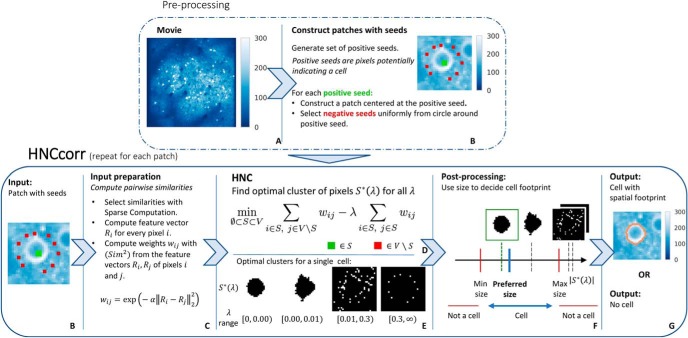
Figure 3.
Overview of the HNCcorr algorithm. The top and bottom rows, respectively, summarize the preprocessing steps and the main steps of the algorithm. A, Average intensity image of the input dataset consisting of a calcium-imaging recording. B, Average intensity image of a patch constructed for a positive seed (green) and the corresponding negative seeds (red). C, Description for computing the pairwise similarity weight between two pixels. D, HNC is the clustering model solved to segment a single cell. E, Optimal clusters for the HNC problem as a function of λ. Black pixels are selected for the cluster, denoted by S *(λ). F, Visualization of the postprocessing step. Clusters that are too small/large are discarded. The remaining cluster closest to the preferred size is selected as the footprint of a cell. G, Output for a single patch; the footprint of a cell if a cluster was selected, or “No cell” if all clusters are discarded.

