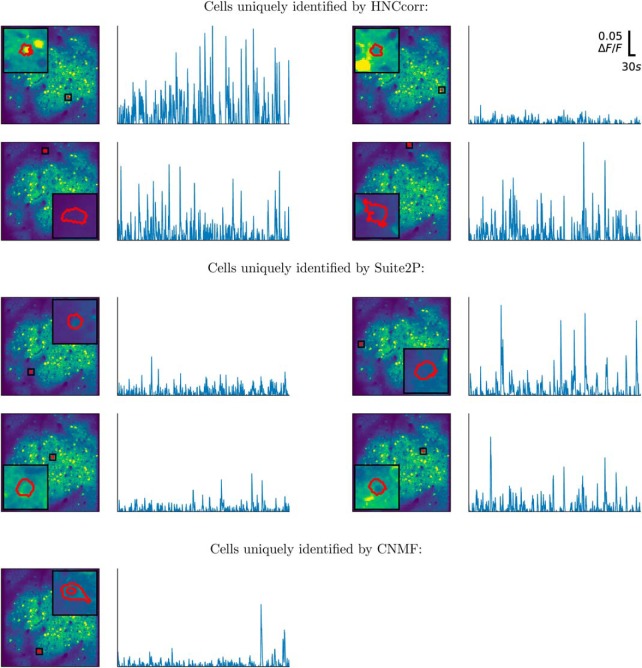
Figure 7.
Footprints and ΔF/F signals for annotated cells in the Neurofinder training dataset 02.00 that were uniquely identified by one of the algorithms. Segmented footprints and ΔF/F signal for up to four cells are shown for each of the algorithms. Each cell also appeared in the reference annotation, but it was not identified by any of the other algorithms. The segmented spatial footprints are overlaid on the mean intensity image, scaled to show values from the first percentile up to the 99th percentile.

