
Figure 3.
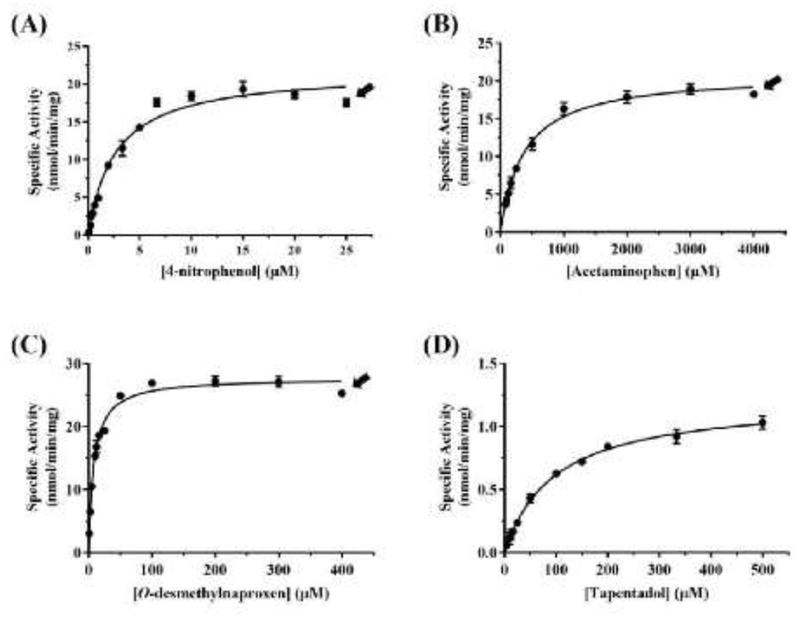
Kinetic analysis of the sulfation of the tested substrates by wild-type human SULT1A1.(A), (B), (C), and (D) show the nonlinear Michaelis–Menten curves for the sulfation of, respectively, 4NP, acetaminophen, O-DMN, and tapentadol. The nonlinear curves were generated using GraphPad Prism® 7 software. Arrow signs indicate the concentrations at which substrate inhibition started taking place. Data shown represent calculated mean ± standard deviation derived from three experiments.