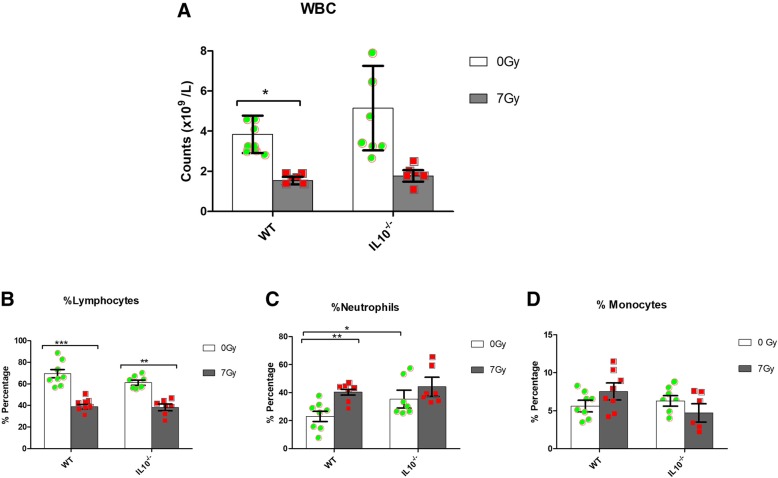
Fig. 1.
Total white blood cell count and percentages of different blood cell types in WT and Il10−/− mice after 24 h of radiation exposure (7Gy). a Total WBC count b Lymphocyte (%) c Neutrophils (%) d Monocytes (%). Significant differences *P < 0.05; **P < 0.01; ***P < 0.001 (n = 8). Green circles (control) and red squares (irradiated) indicate values for individual animals of the respective genotype

