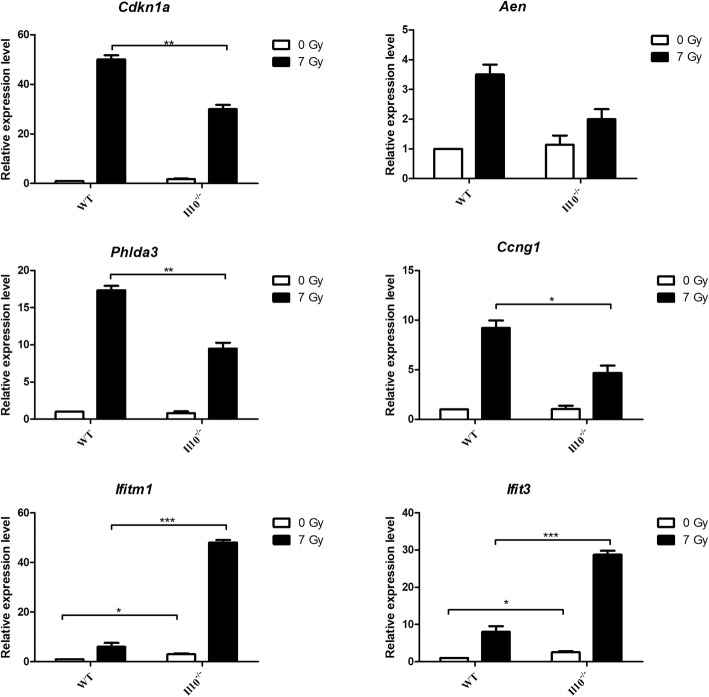
Fig. 6.
Gene expression measured by qRT-PCR. Expression levels of 6 genes (Cdkn1a, Aen, Phlda3, Ccng1, Ifitm1, Ifit3) showing significant difference in expression in Il10−/− mice compared to WT after radiation exposure are presented here. The expression level for each gene was calculated relative to the expression levels in unexposed WT animals considered as 1. The expression was normalized against Beta-Actin gene expression. The data is represented as mean +/− SEM (n = 5). * Significant at P < 0.05, ** Significant at P < 0.01, *** Significant at P < 0.001, using unpaired t-test

