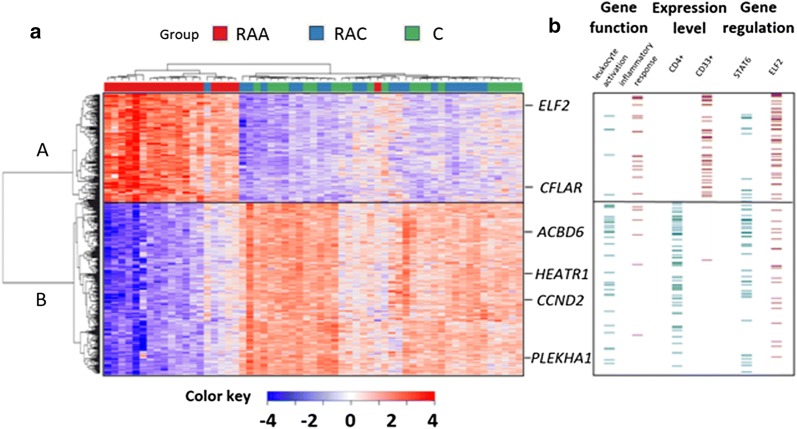
Fig. 1.
Profiling of transcriptional alterations in the peripheral blood cells of patients after IA rupture. a Hierarchical clustering of transcripts regulated in response to IA rupture. RNA-seq results are shown as a heat map and include 491 transcripts with a genome-wide significance (FDR < 0.01%) from one-way ANOVA for the factor of clinical status. Gene transcripts with altered RNA abundance levels are listed in Additional file 4: Table S3. Colored rectangles represent transcript abundance measured in the samples described above (RAA: acute phase of IA rupture, RAC: chronic phase of IA rupture, C: healthy controls). The intensity of the color is proportional to the standardized values (between −4 and 4) from each RNA-seq measurement, as indicated on the bar below the heat map image. Hierarchical clustering was performed with the R software using distance metric—correlation and the average linkage method. Two major gene transcription patterns in peripheral blood associated with IA rupture were arbitrarily denoted as A and B. Changes in the expression of six example genes (labeled on the right) were analyzed by using qPCR. b The analysis of gene expression patterns using data-mining methods. Functional enrichment among genes with similar expression profiles was identified by using the Enrichr analysis tool. Overrepresentation of functional links, TFBSs and expression in the particular cell types were indicated on the right. The examples of functional enrichment were indicated, and the complete results of the analysis are presented in Additional file 5: Table S4

