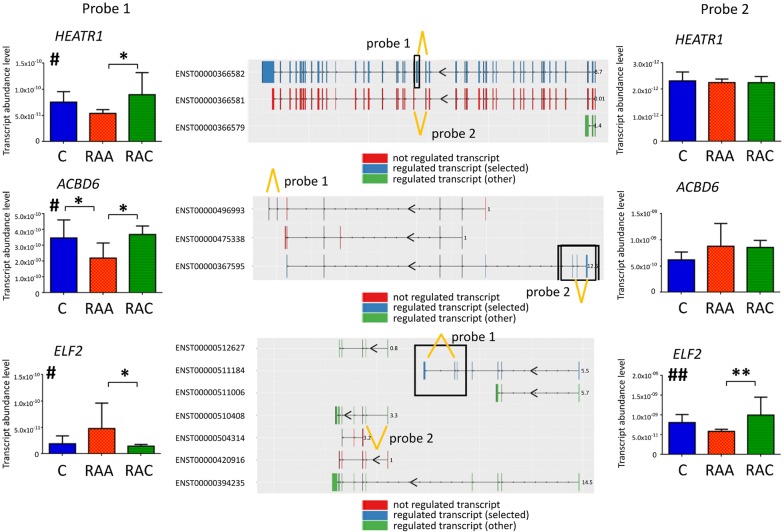
Fig. 3.
Validation of gene isoform-specific transcriptional alterations induced in response to IA rupture in peripheral blood. The expressions of HEATR1, ACBD6 and ELF2 transcripts were measured (Ensembl transcripts IDs are presented in the middle). qPCR analyses were performed to confirm isoform specific regulation using the same samples (n = 11–14). TaqMan probes allow for distinguishing between specific transcriptional variants. The assay locations are indicated by yellow lines. Bars indicate S.E.M, #p < 0.05 from one-way ANOVA (factor of clinical status) followed by Tukey’s multiple comparisons test to identify differences between the groups (*p < 0.05, **p < 0.01)

