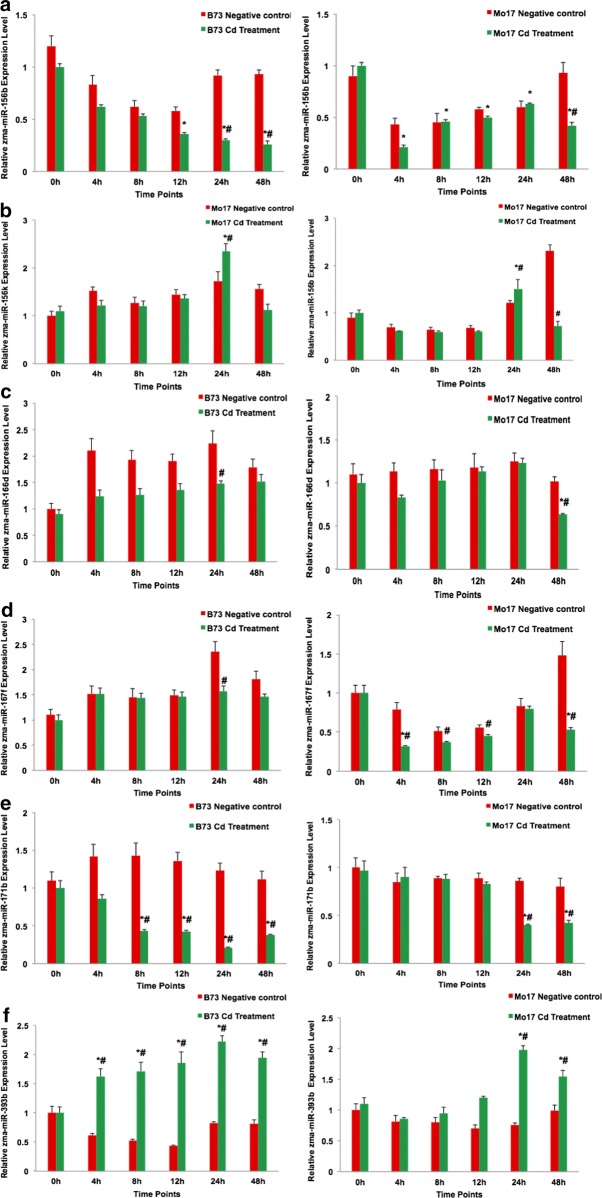
Fig. 2.
Validation of candidate microRNAs related to Cd stress using qRT-PCR. Left: B73, right; Mo17. Red and green vertical bars indicate the negative control (CK) and the Cd treatment, respectively. The letters A to F indicate the expression levels of Zma-miR156b, Zma-miR156k, Zma-miR166d, Zma-miR167f, Zma-miR171b, and Zma-miR393b. Shown are the mean ± SEM. *p < 0.05 Cd exposure time vs. 0 h; #p < 0.05 treatment vs. negative control

