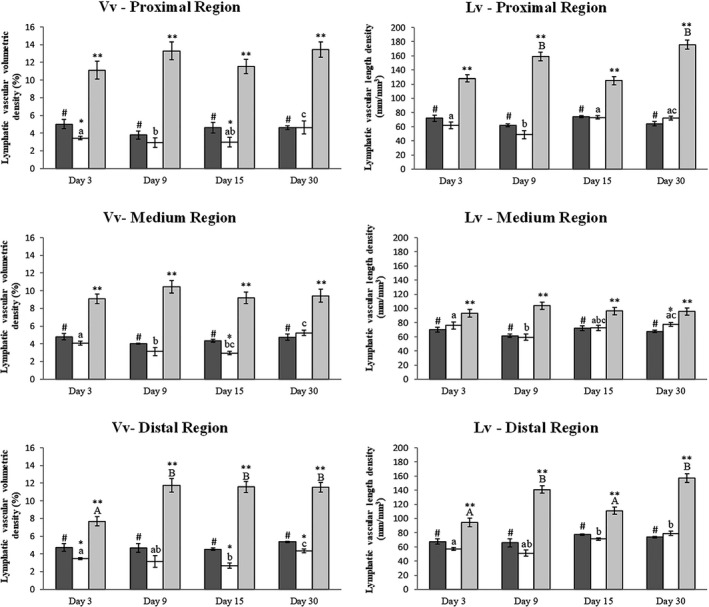
Figure 3.

Lymphatic vascular volumetric density (Vv) and Lymphatic Vascular length density (Lv) in the left hind limb of mice. Lymphatic vascular volumetric density (Vv) and Lymphatic Vascular length density (Lv) in the left hind limb of mice. Graphs showing comparison of Vv and Lv between the Control (dark gray columns), Surgery (white columns) and Treatment (light gray columns) groups of animals euthanized on days 3, 9, 15 and 30 after surgery. The bars represent the mean ± standard deviation. Asterisk (*) indicates significant difference (P < 0.05) between the Surgery and Control groups in the same observation time, (**) indicate significant differences (P < 0.05) between Surgery and Treatment groups in the same observation time, (#) indicates significant difference (P < 0.05) between the Treatment and Control groups at the same time of observation, different lowercase letters indicate the effect of time on the Vv and Lv in the Surgery groups and different capital letters indicate the effect of time on the Vv and Lv in the Treatment groups.
