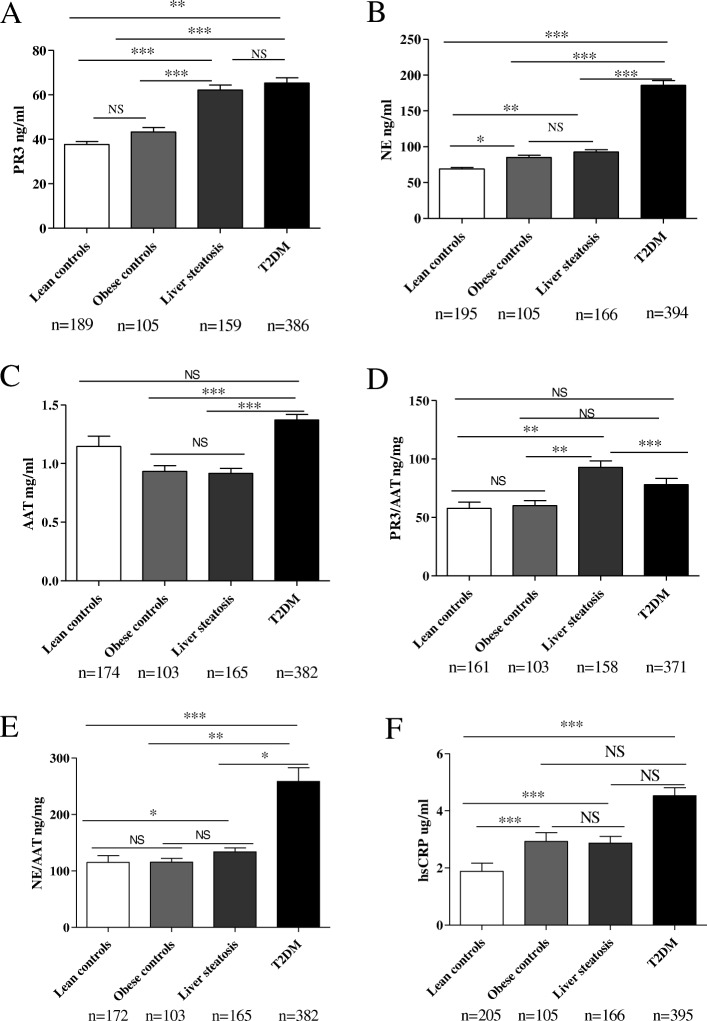
Fig. 1.
PR3, NE, AAT and hsCRP plasma concentrations in patients with liver steatosis and type 2 diabetes versus lean and obese controls. a PR3 plasma concentrations in patients with liver steatosis and type 2 diabetes versus lean and obese controls. b NE plasma concentrations in patients with liver steatosis and type 2 diabetes versus lean and obese controls. c AAT plasma concentrations in patients with liver steatosis and type 2 diabetes versus lean and obese controls. d PR3 to AAT ratio in patients with liver steatosis and type 2 diabetes versus lean and obese controls. e NE to AAT ratio in patients with liver steatosis and type 2 diabetes versus lean and obese controls. f hsCRP concentrations in patients with liver steatosis and type 2 diabetes versus lean and obese controls. Data is represented as mean ± SEM. *p < 0.05, **p < 0.01, ***p < 0.001, NS = p > 0.05

