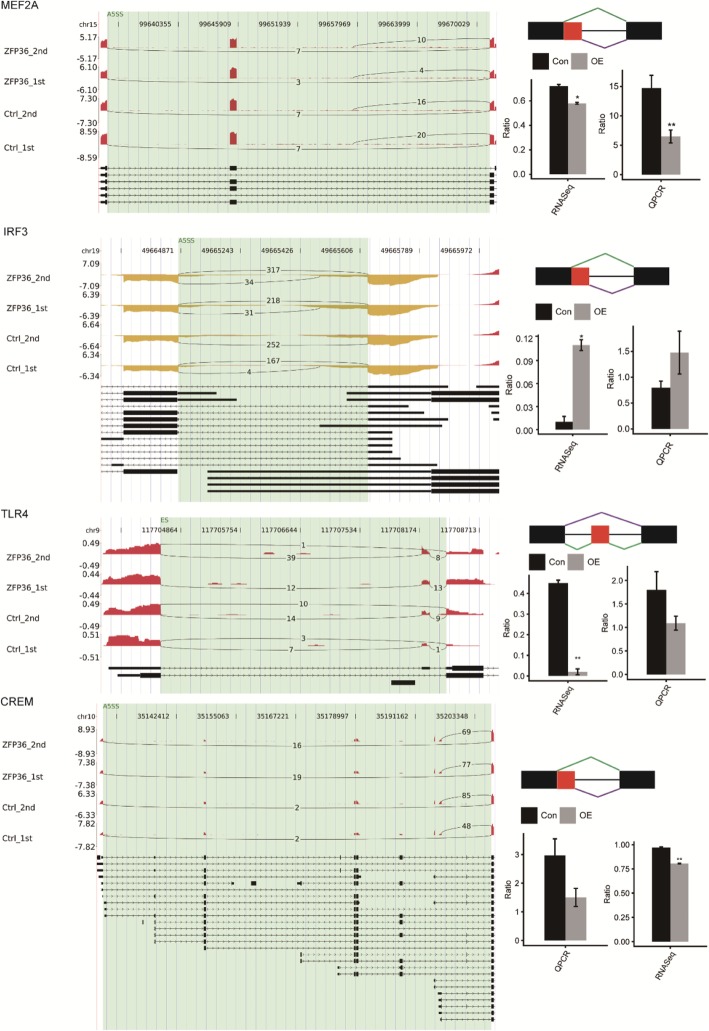
Fig. 5.
Validation of TTP-mediated AS events. (Left panel) IGV-sashimi plots showing the alternative splicing changes that occurred in the control or ZFP36-OE HeLa cells. The results for MEF2A, IRF3, TRL4, and CREM are presented. For each gene, the left panel shows the transcript isoforms of each gene (bottom) and the density map of all RNA-seq read distribution around the gene regions involved in the alternative splicing events (top) from the four samples. Alternative splicing isoforms of each AS event are depicted. The number of reads supporting each isoform are shown (top). In the right panel of each gene, the schematic diagram (top) depicts the structure of each alternative splicing event, AS1 (shown in purple) and AS2 (shown in green); exon sequences are denoted by boxes and intron sequences by the horizontal line. RNA-seq quantification and RT-PCR validation of alternative splicing regulation is shown at the bottom. The altered ratio of AS events in the RNA-seq were calculated using the formula: AS1 junction reads/AS1junction reads + AS2 junction reads. The altered ratio of AS events assessed by q-PCR were calculated using the formula: AS1 transcript level/ AS2 transcript level. The transcripts for the genes are presented below

