Fig. 1.
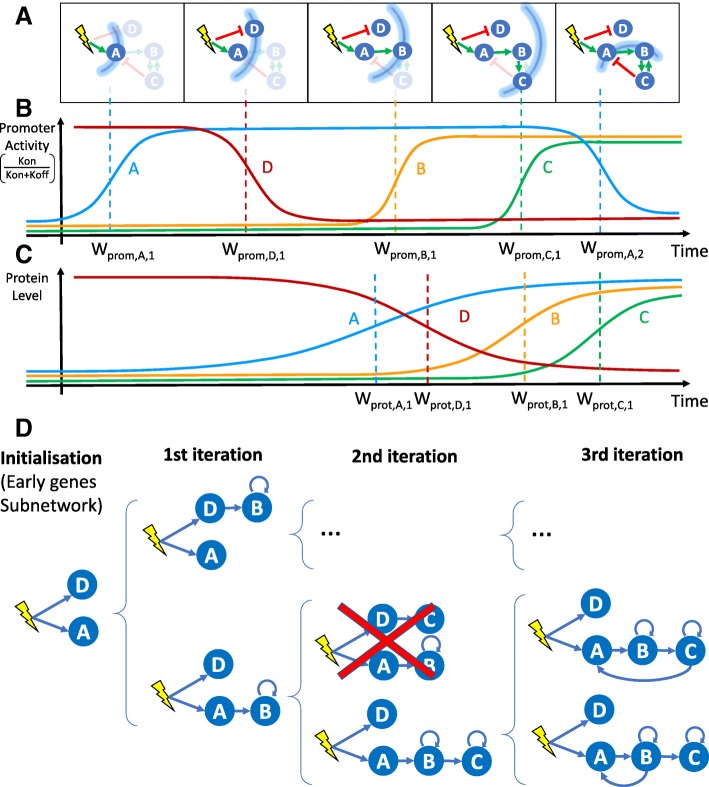
WASABI at a glance. a Schematic view of a GRN: the stimulus is represented by a yellow flash, genes by blue circles and interactions by green (activation) or red (inhibition) arrows. The stimulus-induced information propagation is represented by blue arcs corresponding to wave times. Genes and interactions that are not affected by information at a given wave time are shaded. At wave time 5, gene C returns information on gene A and B by feedback interaction creating a backflow wave. b Promoter wave times: Promoter wave times correspondto inflections point of gene promoter activity defined as the kon/(kon+koff) ratio. c Protein wave times: Protein wave times correspondto inflections point of mean protein level. d Inference process. Blue arrows represent interactions selected for calibration. Based on promoter waves classification genes are iteratively added to sub-GRN previously inferred to get new expanded GRN. Calibration is performed by comparison of marginal RNA distributions between in silico and in vitro data. Inference is initialized with calibration of early genes interaction with stimulus, which gives initial sub-GRN. Latter genes are added one by one to a subset of potential regulators for which a protein wave time is close enough to the added gene promoter wave time. Each resulting sub-GRN is selected regarding its fit distance to in vitro data. If fit distance is too important sub-GRN can be eliminated (red cross). An important benefit of this process is the possibility to parallelize the sub-GRN calibrations over several cores, which results in a linear computational time regarding the number of genes. Note that only a fraction of all tested sub-GRN is shown

