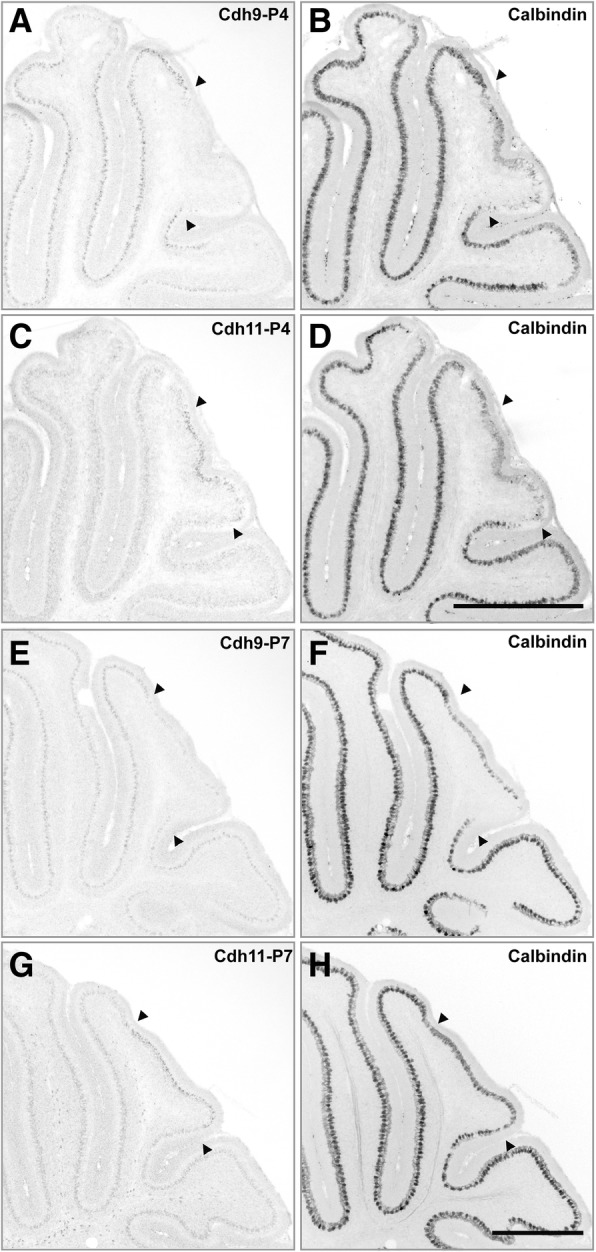
Fig. 5.

Relationship between cadherins and calbindin during the first postnatal week. In situ hybridization followed by calbindin staining was performed on P4 (a-d) and P7 (e-h) sagittal sections. a and b sections show Cdh9 expression signals in high calbindin-expressing areas. c and d sections show Cdh11 in low calbindin-expressing areas (central area of lobules VI/VII). A similar expression pattern was observed at stage P7 (e-h). Arrow heads mark the area of central VI/VII. Scale bars: 500 μm
