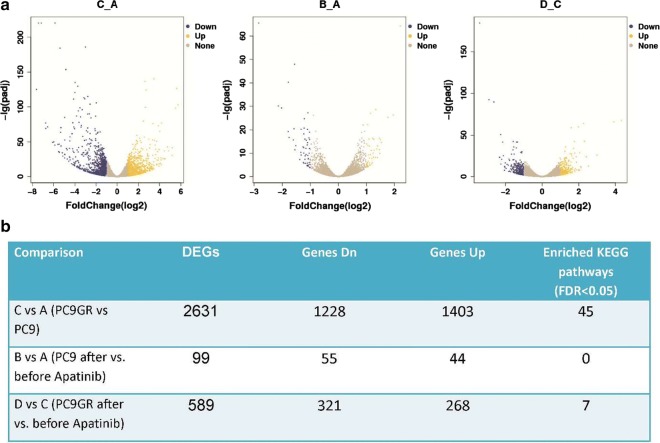
Fig. 4.
Differentially expressed genes among different groups of PC9/PC9GR cells from RNA sequencing. a Vocano plot of differentially expressed genes (DEGs) between C vs. A, B vs. A, and D vs. C group. X-asix represents log2 fold change, blue for down expression and yellow for up expression. b Summary of DEGs and enriched pathways

