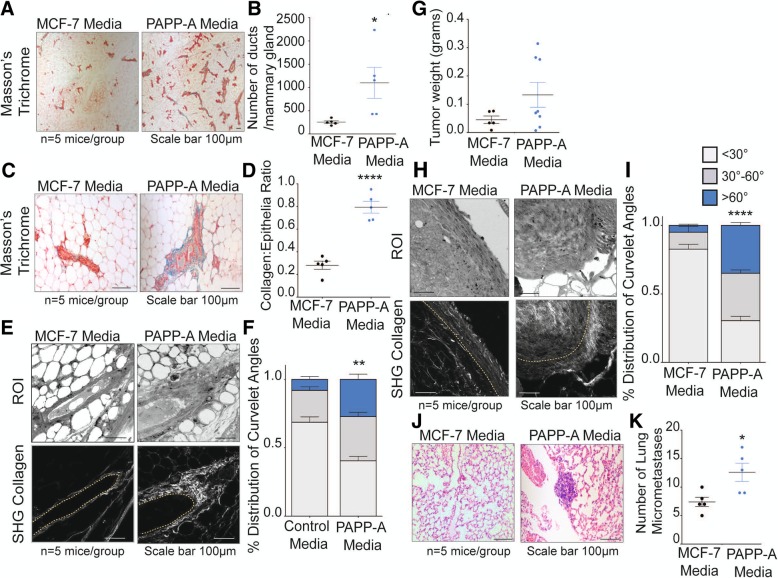
Fig. 2.
PAPP-A converts post-partum collagen into an altered, pro-tumorigeneic involution-like collagen phenotype. a Representative images of the mammary ducts stained with Masson’s trichrome collagen (blue) on non-transgenic late post-partum mammary glands treated with control or PAPP-A injections. n = 5 mice per group. Scale bar 100 μm (images were taken at × 5). b Quantification of the number of ducts per mammary gland from non-transgenic post-partum mice treated with control or PAPP-A media injections. n = 5 mice per group, each point represents the average of each mouse per group. Mean ± SEM, unpaired t test: *p < 0.05). c Representative images of Masson’s trichrome collagen stain (blue) on non-transgenic post-partum mammary glands treated with control or PAPP-A media injections. n = 5 mice per group. Scale bar 100 μm. d Quantification of collagen per epithelial region by Masson’s trichrome stain on non-transgenic post-partum mammary glands treated with control or PAPP-A media injections. n = 5 mice per group, each point represents the average of ten ducts per mouse per group. Mean ± SEM, unpaired t test with Welch’s correction. ****p < 0.0001. e Representative second-harmonic generation (SHG) imaging of collagen on magnified ducts of histological sections of non-transgenic late post-partum mammary glands treated with control or PAPP-A media injections (lower panels). Yellow dotted lines indicate the mammary duct borders. Corresponding regions of interest (ROI) are shown in the top panels. n = 5 mice per group. Scale bar 100 μm. f Quantification of TACS3 per total curvelets analyzed in non-transgenic post-partum mammary glands treated with control or PAPP-A media injections using the CurveAlign software. TACS3 characterized as curvelet angles 60–90 relative to the ductal border. n = 5 mice per group. Mean + SEM, unpaired t test with Welch’s correction (comparisons between the TACS3 group only). **p < 0.005. g Tumor weights at time of harvesting Met1 xenograft tumors from non-transgenic post-partum mice treated with control or PAPP-A media injections. n = 5 mice per group, two xenografts injected per mouse. In the MCF-7 media group, 5/10 tumors took while 8/10 tumors grew in the PAPP-A media group. Each point represents a tumor weight. Mean ± SEM. h Representative second-harmonic generation (SHG) imaging of collagen on magnified histological sections of Met1 xenograft tumors in non-transgenic late post-partum mice treated with control or PAPP-A media injections (lower panels). Yellow dotted lines indicate the mammary duct borders. Corresponding regions of interest (ROI) are shown in the top panels. n = 5 mice per group. Scale bar 100 μm. i Quantification of TACS3 per total curvelets analyzed in Met1 xenograft tumors in non-transgenic late post-partum mice treated with control or PAPP-A media injections using the CurveAlign software. TACS3 characterized as curvelet angles 60–90 relative to the ductal border. n = 5 mice per group. Mean + SEM, unpaired t test with Welch’s correction (comparisons between the TACS3 group only). ****p < 0.0001. j Representative images of lung micrometastases in post-partum non-transgenic mice xenografted with Met1 cells and treated with control or PAPP-A media injections. n = 5 mice per group. Scale bar 100 μm. k Quantification of lung micrometastases in post-partum non-transgenic mice xenografted with Met1 cells and treated with control or PAPP-A media injections. n = 5 mice per group, each point represents the average of lung micrometastases per mouse. Mean ± SEM, unpaired t test with Welch’s correction: *p < 0.05

