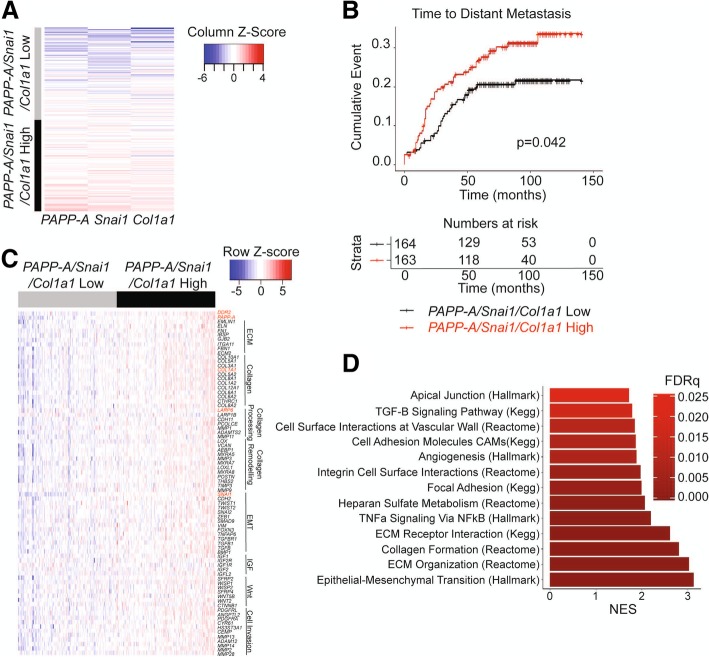
Fig. 6.
PAPP-A/SNAI1/COL1A1 gene signature correlates with distant metastasis in breast cancer patients. a Heatmap of patients clustered based on their score for the PAPP-A/SNAI1/COL1A1 signature (categorized according to the mean score value). Each row represents one patient, n = 327. b Kaplan-Meier curve for time to distant metastasis according to the PAPP-A/SNAI1/COL1A1 score as defined in a. Number of patients at risk at each time point over a 150-month period is recorded below in table. c Heatmap representing the relative expression of a selected panel of 78 genes (FDR < .05) in the PAPP-A/SNAI1/COL1A1-low and PAPP-A/SNAI1/COL1A1-high patient populations. Genes are organized by pathways, as labeled adjacent to the gene names. The red text highlights relevant genes investigated in this study (PAPP-A, DDR2, SNAI1, COL1A1, and LARP6). Each column represents a patient, and each row represents a gene. d Chart of GSEA pathways significantly enriched in the PAPP-A/SNAI1/COL1A1-high patient population. Each bar represents the normalized enrichment score of the indicated pathway

