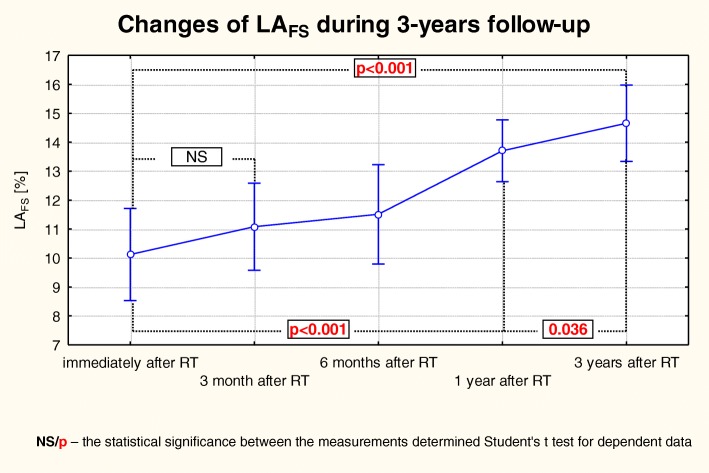
Fig. 6.
Changes of LAFS over the 3-year follow-up observation in patients after KTx. The trend of changes for the whole period of observation: the Anova test with repeated measurements and the comparison of measurements in particular periods of observation and the Student’s t- test for dependent variables

