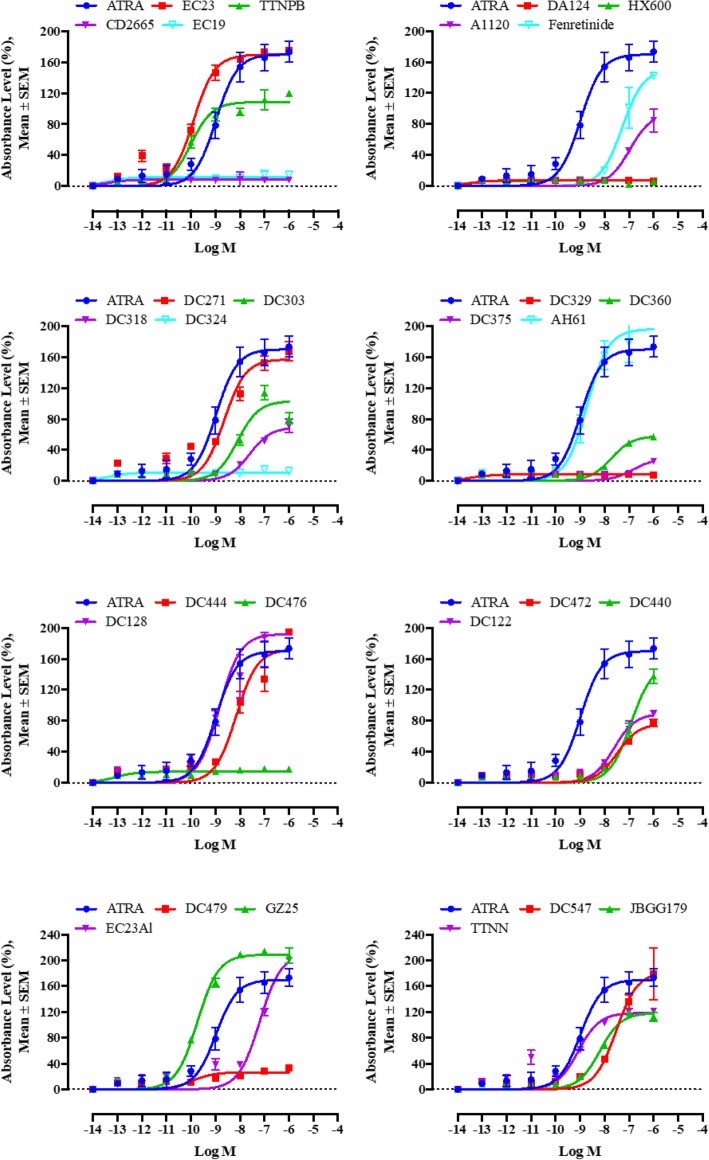
Fig. 2.
The concentration-response graph for log (agonist) vs. sigmoidal dose-response in evaluating ATRA versus retinoids in inducing genomic response of Sil-15 reporter cells. Absorbance values of different retinoid doses were measured at 650 nm and analysed using sigmoidal dose-response curves. Shown are average absorbance of three independent experiments. Error bars indicate standard error of the mean (SEM). Statistically significant differences are indicated by non-overlapping 95% CI

