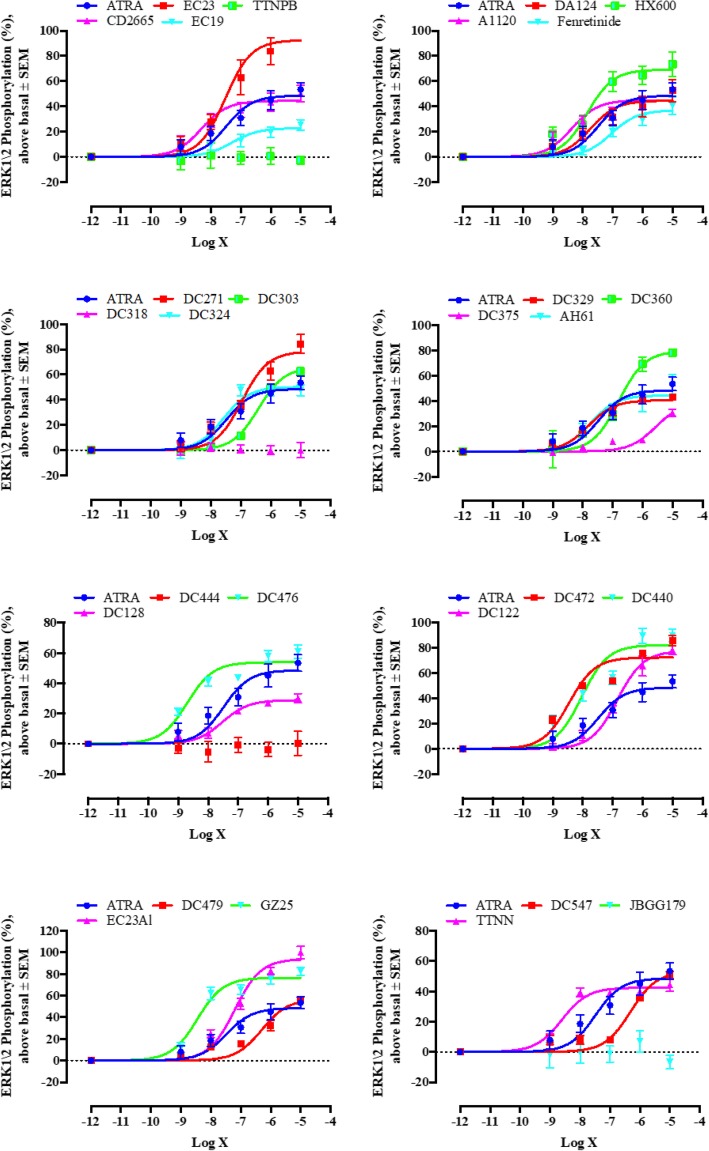
Fig. 4.
Sigmoidal concentration-response graphs for induction of ERK1/2 phosphorylation in SH-SY5Y cells. Absorbance values of different retinoid doses were measured at 570 nm. The average absorbance in three independent experiments are shown. Error bars indicate SEM. There was a statistical difference in the potency (EC50) between ATRA and (A1120, CD2665, HX600, GZ25, DC329, DC440, DC472, DC476, TTNN), and the efficacy (Emax) between ATRA and (EC23, EC23Al, HX600, GZ25, DC122, DC271, DC303, DC360, DC440, DC472, DC476, DC479) calculated by the non-overlapping 95% CI

