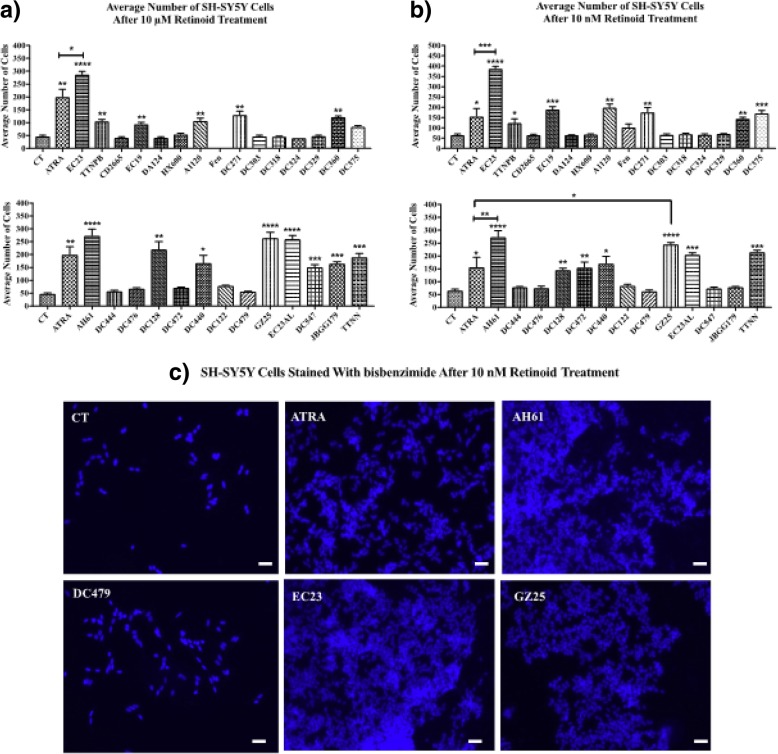
Fig. 6.
Increase in number of SH-SY5Y cells treated with retinoids. SH-SY5Y cells were treated with the retinoids or DMSO CT treatment for 5 days, and then number of cells evaluated by staining with bisbenzimide dye and counting the cells. The average number of SH-SY5Y cells after a) 10 μM and b) 10 nM compound treatment was measured and compared with the control and ATRA. Shown are mean values of three independent experiments. Error bars indicate SEM (* p < 0.05; ** p < 0.01; *** p < 0.001; **** p < 0.0001 one-way ANOVA with Newman-Keuls multiple comparison test). c) Representative micrographs of SH-SY5Y cells stained with bisbenzimide dye after 10 nM retinoid treatment for 5 days (scale bar = 18 μm)

