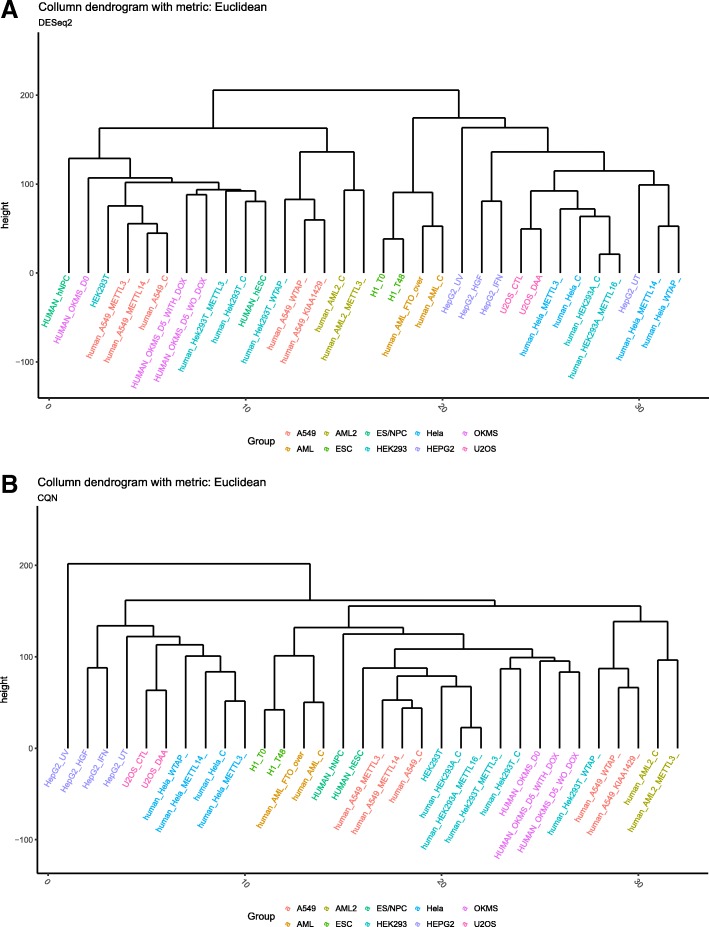
Fig. 1.
Correction of technical variability. a The clustered dendrogram of samples before applying CQN to remove technical variability. Many highly related samples are not clustered closely. b The clustered dendrogram of samples after applying CQN to remove technical variability. More related samples are clustered together, suggesting that the application of CQN in the analysis is very effective

