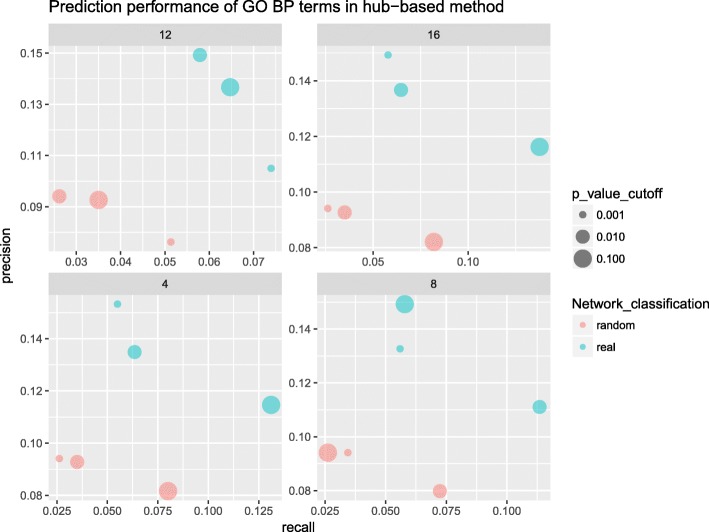
Fig. 4.
Performance of hub-based functional prediction. In the recall-precision plot, blue circles represent values under the real network, and red circles represent values under the random network. The x-axis and y-axis give the respective values of recall and precision. The number labelled as title in each facet represents each GN cutoff. The lower PV cutoff represent the smaller circle in the figure. From the figure, the values of recall and precision in the real network are much higher than the random network with the same cutoff

