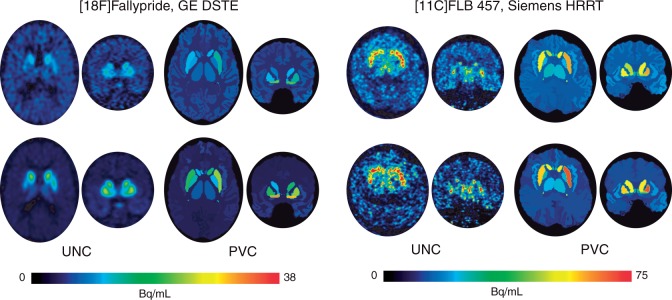
Figure 1.
Example PET images (axial/transverse and coronal) of tracer uptake at frame 18 (top row) and frame 25 (bottom row) for a 60-year-old male subject within the Fallypride data collected with a GE DSTE data (left) and a 60-year-old male subject within the FLB data collected with a Siemens HRRT (right).

