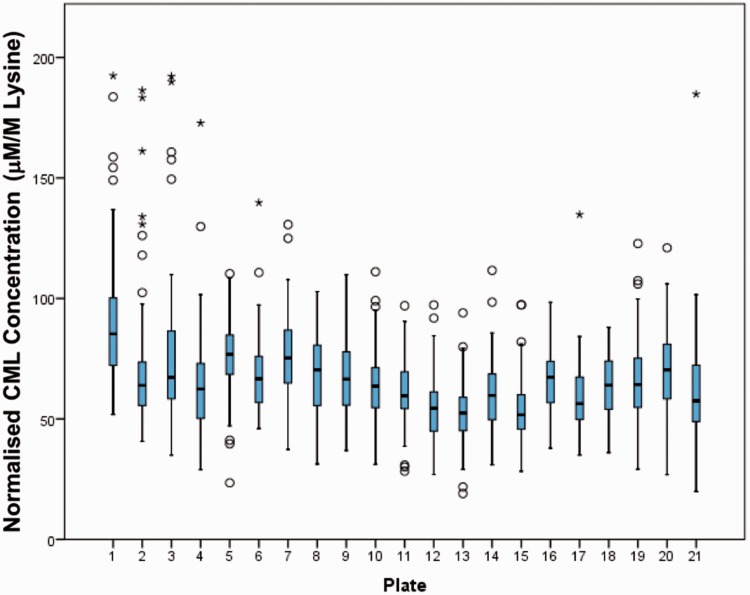
Figure 3.
Box plots showing median (line), box (interquartile range) and whiskers (<1.5 × IQR) for normalized CML concentration in BRHS plasma samples run in each batch, arranged by plate number (n = 95 per batch). The circles represent outliers (<3 × IQR) and the stars represent extreme outliers (>3 × IQR). No obvious trends are observed from batch to batch; samples were randomized before sample preparation. Normalized CML concentrations of ≥ 200 mM/M lysine were excluded from the figure for clarity.
CML: carboxymethyl lysine.

