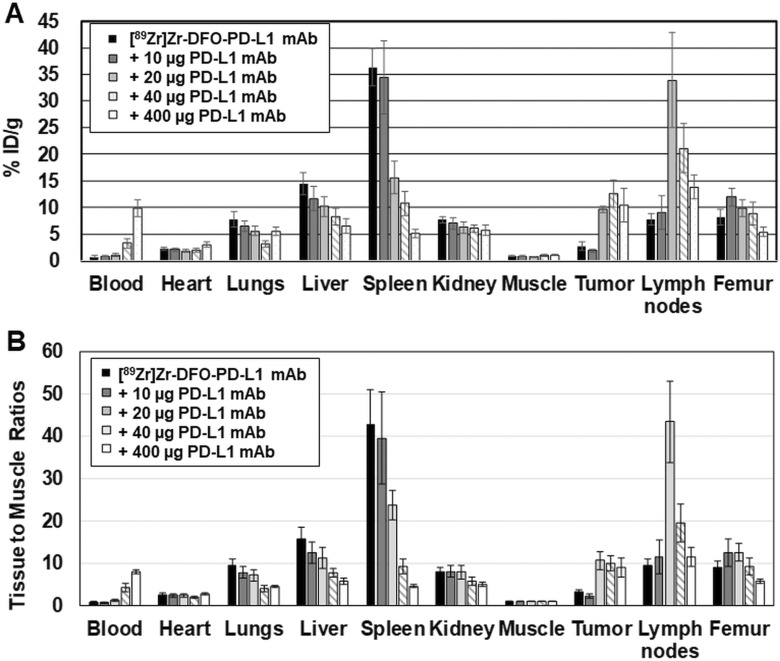
Figure 4.
(A) Biodistribution (%ID/g) of [89Zr]Zr-DFO-PD-L1 mAb in MDA-MB231 xenografts 3 days after receiving coinjections of [89Zr]Zr-DFO-PD-L1 mAb (∼2 μg) + unlabeled PDL1 mAb (0, 10, 20, 40 and 400 μg). Each bar represents the mean %ID/g ± standard deviation (SD) of [89Zr]Zr-DFO-PD-L1 mAb at each dose of unlabeled PD-L1 mAb (n = 5, 6 for each group). (B) [89Zr]Zr-DFO-PD-L1 mAb tissue (%ID/g) to muscle (%ID/g) ratios in MDA-MB231 xenografts 3 d after receiving coinjections of [89Zr]Zr-DFO-PD-L1 mAb (∼2 μg) + unlabeled PDL1 mAb (0, 10, 20, 40 and 400 μg). Each bar represents the mean ratio ± SD of [89Zr]Zr-DFO-PD-L1 mAb at each dose of unlabeled PD-L1 mAb (n = 5, 6 for each group).

