Figure 1.

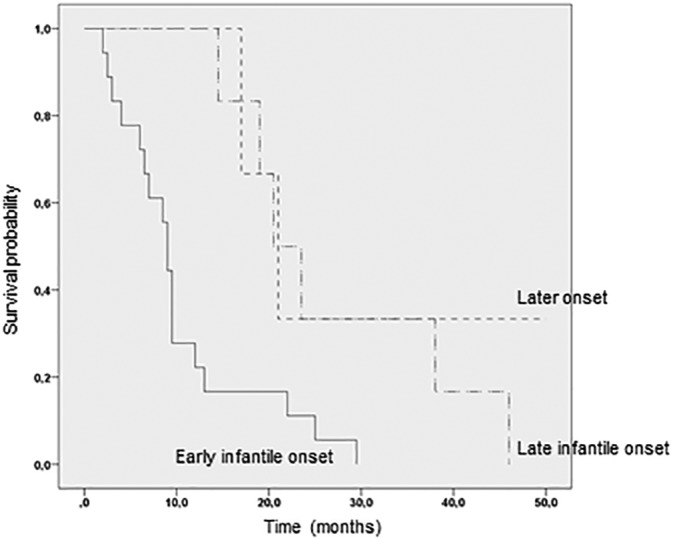
Kaplan‐Meier curve showing longer survival of Krabbe patients with the late infantile phenotype (n = 5) compared to patients with the early infantile form (n = 20). Patients with the later onset phenotype (n = 2) are shown for comparison

Kaplan‐Meier curve showing longer survival of Krabbe patients with the late infantile phenotype (n = 5) compared to patients with the early infantile form (n = 20). Patients with the later onset phenotype (n = 2) are shown for comparison