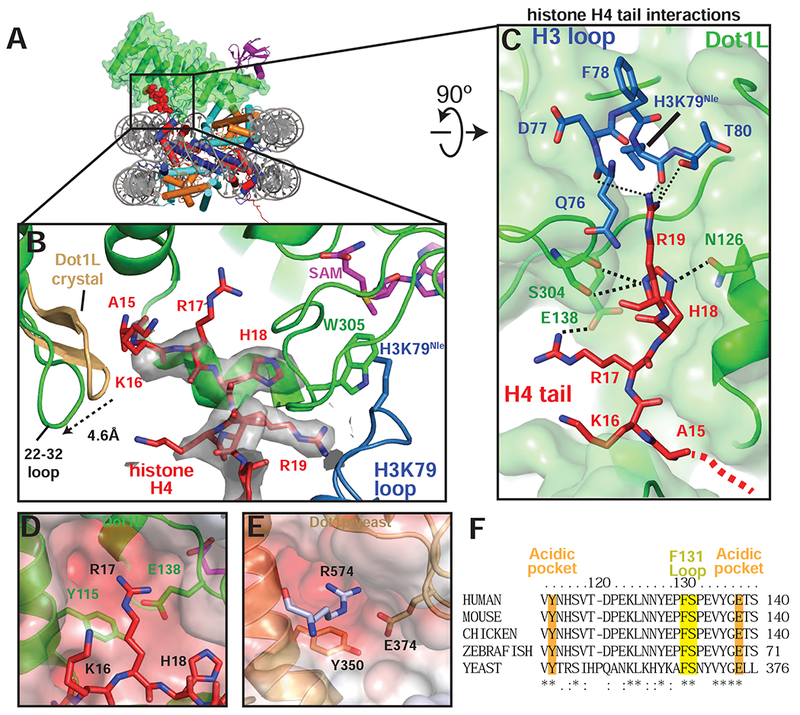
Figure 5: H4 tail interactions with Dot1L.

A, Overview of the active Dot1L structure. Dot1L is shown as a transparent green surface, ubiquitin as purple ribbon, H4 tail in red spheres. B, H4 tail (red) interaction with the Dot1L binding groove. EM density for the H4 tail is shown as a semi-transparent gray surface. The 22-32 loop from the crystal structure of Dot1L alone (PDB ID 1NW3) is colored tan. C, H4 tail (red) interactions between Dot1L (green) and the H3K79 loop (blue). The surface of Dot1L is shown in semi-transparent green. Potential hydrogen bonding or van der Waals interactions are shown as black dashed lines. Red dashed lines illustrate the direction of the H4 mainchain in the Dot1L binding groove. D, Modeled position of H4 R17 binding in the Dot1L acidic pocket. Conserved residues in the binding pocket are depicted as sticks and the surface of Dot1L is shown and colored according the electrostatic potential. E, Close-up view yeast Dot1p (PDB ID 1U2Z) showing arginine from a neighboring Dot1p molecule in the crystal bound in the conserved acidic pocket. Electrostatic surface potential shown as in D. Electrostatic potential in D, E, was calculated using the APBS tool (Baker et al., 2001). F, Multiple Sequence alignment of Dot1L from different species. The alignment was performed with Clustal Omega (Sievers et al., 2011). See also Figure S6 and Table S1.
