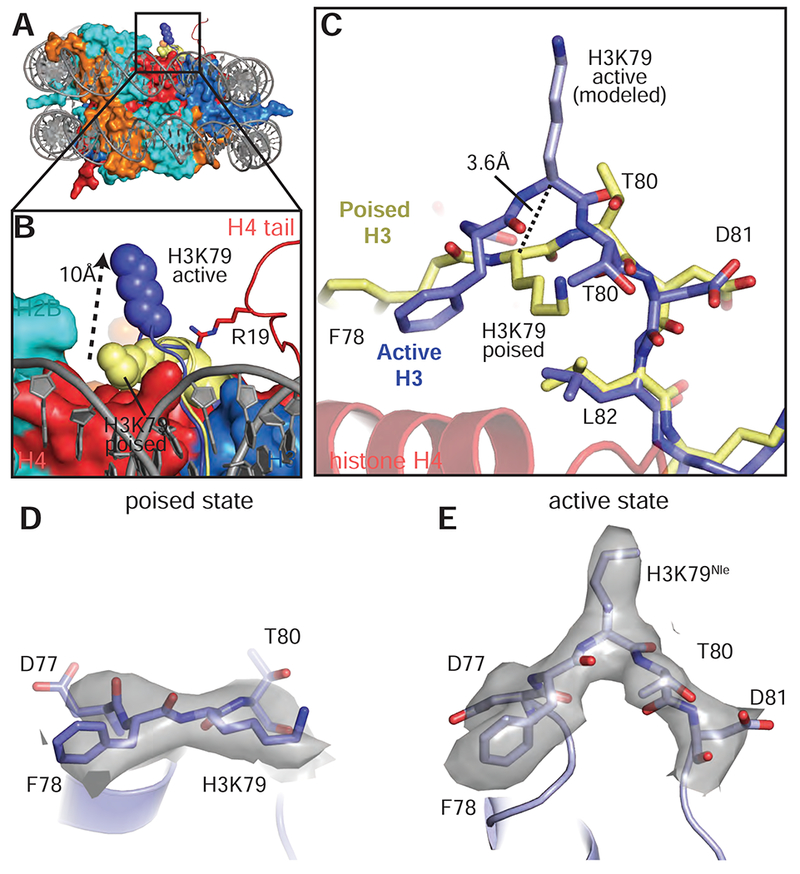
Figure 6: Conformational change in histone H3 reorients K79.

A, Superimposition of the active state and poised state nucleosomes. The active state histone octamer is depicted in surface representation and colored as in Figure 1. The H3K79 loops from the active state (blue) and poised state (yellow) structures are shown as cartoons and H3K79 is shown as spheres. B, Close up view of H3K79 in the active state (blue spheres) and poised state (yellow spheres). The H3K79 sidechain moves ~10 Å (measured from ε-amino groups) from the poised state to the active state. C, Superimposition of the histone H3K79 loop from the active (blue) and poised state (yellow) structures showing the conformational change that occurs in the transition from the poised state to the active state. In the transition from the poised state to the active state the H3K79 backbone moves up by 3.6 Å (measured from the Cα carbons of H3K79) and rotates by an angle of ~90°. D, EM density (gray surface) for the H3K79 loop in the poised state. E, EM density (gray surface) for the H3K79 loop in the active state. See also Figure S7 and Table S1.
