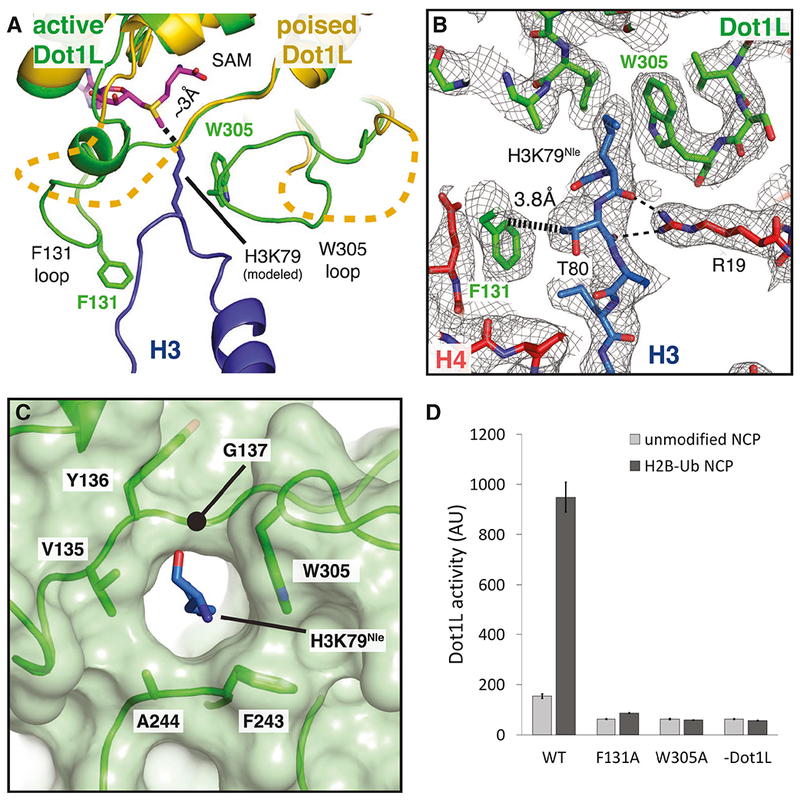
Figure 7: Formation of the Dot1L active site enclosure.

A, Superimposition of active state (green) and poised state (yellow) Dot1L. The H3K79 loop from the active state structure is shown as a blue cartoon and the modeled H3K79 sidechain is shown in stick representation. The disordered F131 and W305 loops from the poised state structure are depicted as yellow dashed lines. The ε- amino group of lysine comes within 3 Å of the SAM methyl donor. B, Close up view of the Dot1L active site enclosure with H3 (blue), Dot1L (green) and H4 (red) shown in stick representation. Sharpened experimental EM density is shown as a gray mesh. A van der Waals contact between Dot1L F131 and H3 T80 is shown as thick a dashed black line and the hydrogen bonds between R19 and the H3K79 loop are shown as thin black dashed lines. C, Formation of the Dot1L H3K79 lysine binding channel. Dot1L is depicted as a green cartoon surrounded by a semi-transparent green surface. H3K79Nle is shown as blue sticks. D, Endpoint H3K79 methylation activity assays using Dot1L mutants with either unmodified or H2B-Ub nucleosomes. Error bars correspond to the standard deviation of 3 replicates. See also Figure S7 and Table S1.
