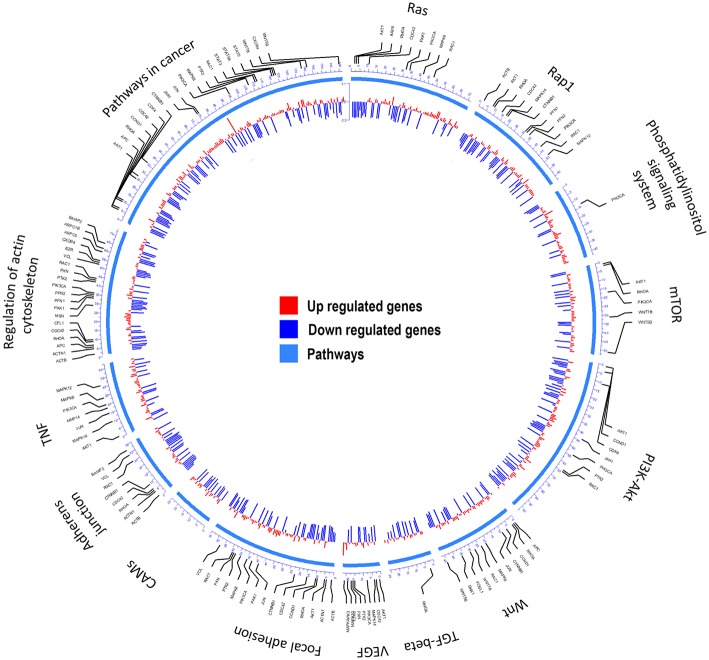
Figure 1.
Summary of the KEGG analyses of over-represented pathways for differentially expressed genes after CKI treatment in MDA-MB-231 cells. From outer to inner, the first circle indicates the pathways; the second shows the genes involved; and the third summarizes significant changes in expression for transcript levels that were upregulated (red) or downregulated (blue) following CKI treatment. P-value cutoff for KEGG analysis was 0.05.

