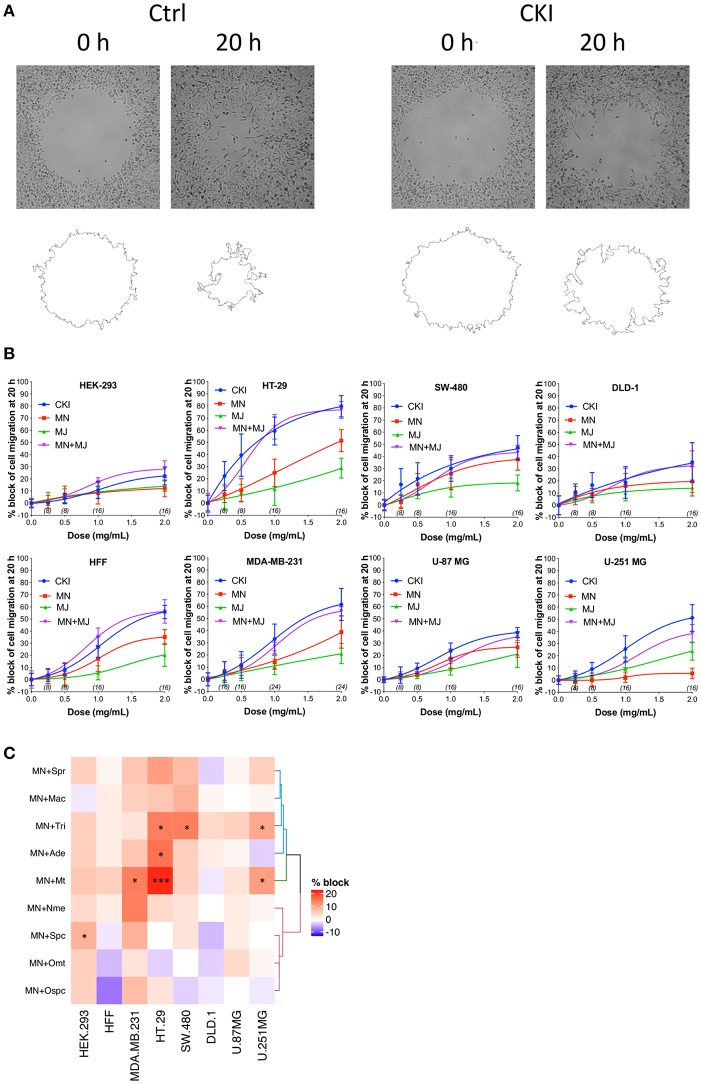
Figure 2.
Dose-dependent inhibition of cell migration by CKI, MJ and MN fractions in eight cell lines, measured by wound closure assays. (A) Wound areas were imaged at 0 h (initial) and after 20 h of treatment. (B) Graphs show percent inhibition of cell migration standardized to the initial wound area, as a function of dose for treatments with CKI (blue), MJ (green), MN (red), and reconstituted CKI with major and minor fractions combined (MN+ MJ; purple). (C) Combinatorial analysis of effects on wound closure for the MN fraction tested in combination with each of nine individual major compounds of CKI, summarized as a heatmap. Data were normalized to values for percentage of migration blocked with MN alone at 0.5 mg/ml. Boxes display the net effects of added single major compounds, as no change (white), increased percentage block (red), or reduced percentage of migration blocked (blue). Statistically significant differences are shown as *p < 0.05 and ***p < 0.001. No symbol in a box indicates the response was not significantly different from that with MN alone.

