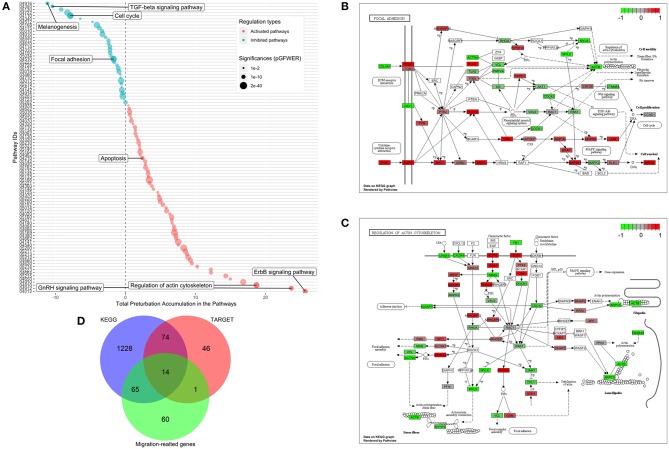
Figure 6.
Identification of significantly perturbed pathways using SPIA analysis. (A) 101 significantly perturbed pathways in MDA-MB-231 treated by CKI 2 mg/ml were observed. Total perturbation values are shown on the x-axis, and pathway IDs are on the y-axis. The global perturbation P-value (pG < 0.05) was used. (B) Significantly perturbed “focal adhesion” pathway in MDA-MB-231 treated by CKI 2 mg/ml. (C) Significantly perturbed “regulation of actin cytoskeleton” pathway in MDA-MB-231 treated by CKI 2 mg/ml. Up- and down-regulated genes are shown in red and green, respectively and genes that were not affected by CKI treatment are shown in white or gray. (D) 14 “core genes” that are found across three different datasets (see Methods).

