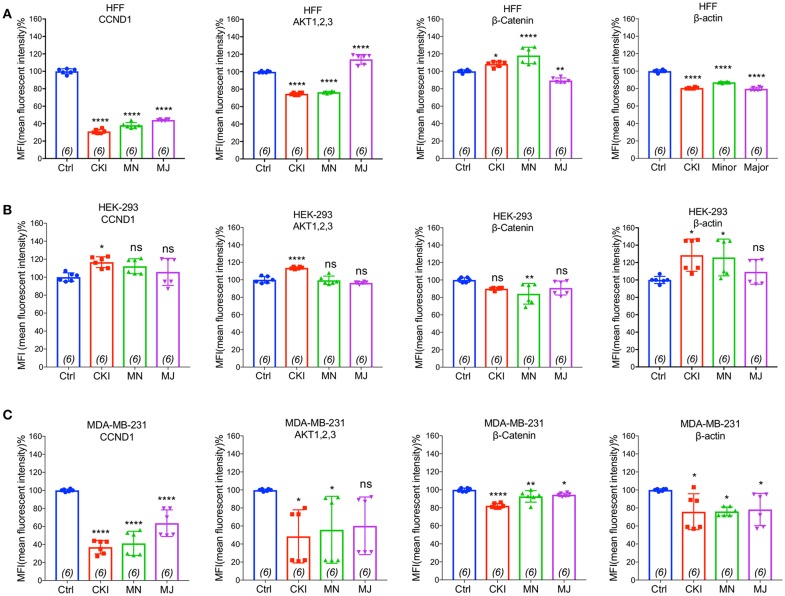
Figure 8.
Flow cytometry analyses of four proteins: CTNNB1, AKT (1–3), CCND1, and ACTB compared in three cell lines with and without CKI-based treatments. The levels of protein expression for four genes predicted by transcriptomic analysis to be significantly down-regulated were evaluated by FACS in three cell lines (A) MDA-MB-231, (B) HEK-293, and (C) HFF. Statistically significant differences compared to vehicle controls were analyzed using one-way ANOVA and post hoc tests and are shown as *p < 0.05, **p < 0.01, ***p < 0.001, ****p < 0.0001, and not significant (ns).

