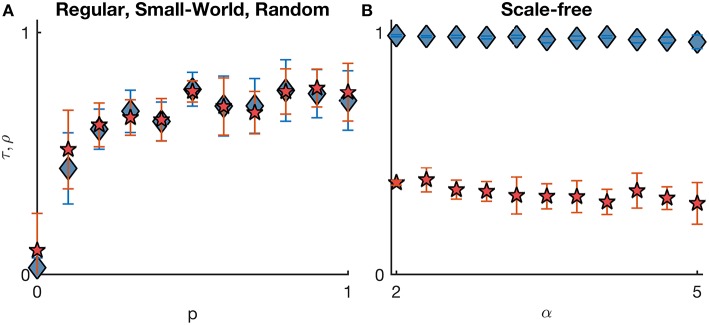
Figure 2.
Comparison between SL and NI distributions across different undirected networks with homogeneous excitabilities. The comparison is quantified by the weighted Kendall's rank τ (blue diamonds) and Pearson correlation ρ (red pentagrams). (A) represents regular (p = 0), random (p = 1), and small-world networks (with varying probabilities of rewiring 0 < p < 1); whilst (B) corresponds to scale-free networks (with varying degree distribution exponent α). Error bars account for the variability of τ and ρ across 10 network realizations per each topology. All networks have mean degree c = 8. Other parameters are the same as in Figure 1.

