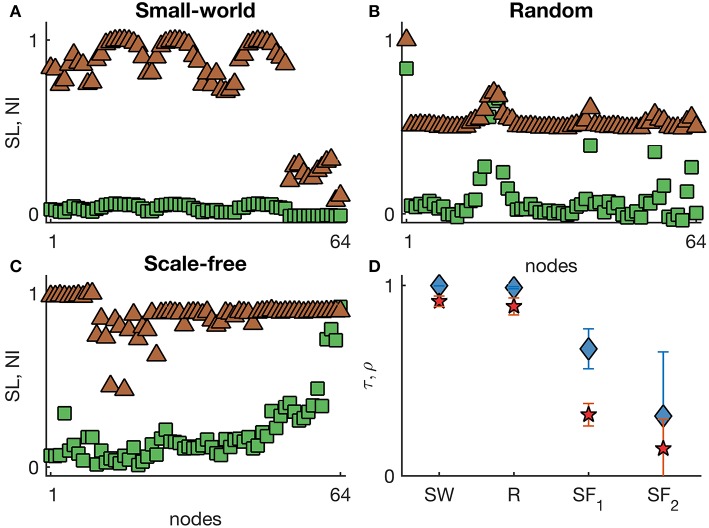
Figure 4.
Representative SL and NI distributions of (A) small-world, (B) random, and (C) scale-free undirected networks with heterogeneous excitabilities. The green squares correspond to NI(i), whilst the brown triangles are SL(i) values. The nodes were sorted by their degree. (D) displays the weighted Kendall's rank τ (blue diamonds) and Pearson correlation ρ (red pentagrams) across different undirected networks with heterogeneous excitabilities (SW: small-world networks with p = 0.1; R: random networks; SF1: scale-free networks with α = 2.3; and SF2: scale-free networks with α = 5). Error bars account for the variability of τ and ρ across 10 network realizations per each topology. Node excitabilities were defined as inversely proportional to node degree within the range [−2.5, −0.5]. Other parameters are the same as in Figure 1.

