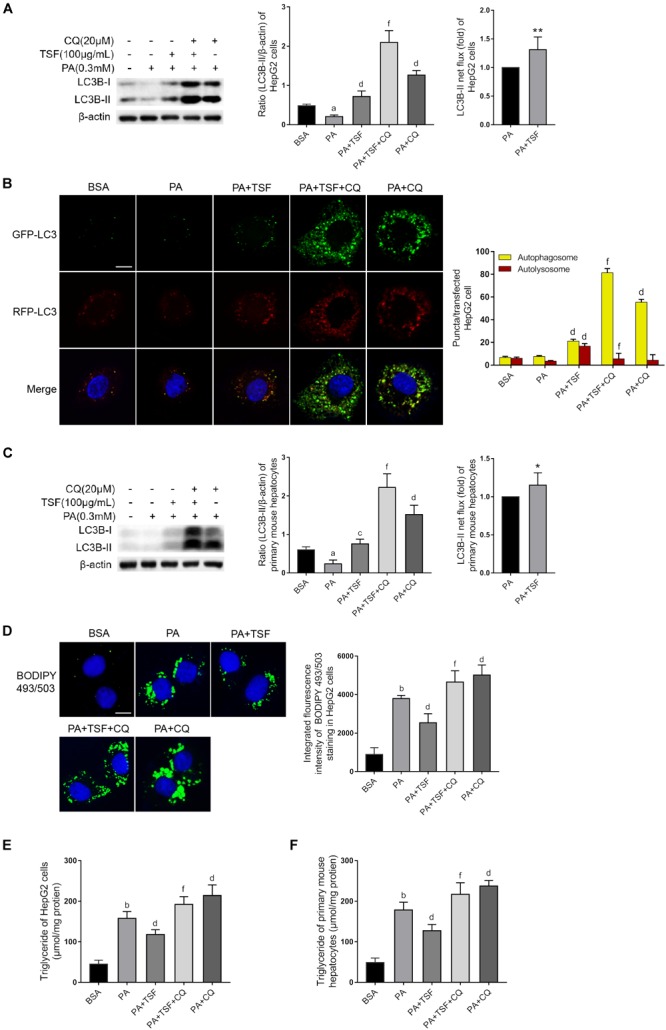
FIGURE 6.

TSF alleviated steatosis through reinforcing autophagy in PA-stimulated hepatic cells. (A,C) Western blot assay and semi-quantitative analysis of LC3B-II of PA-stimulated HepG2 cells and primary mouse hepatocytes in response to TSF and CQ treatment for 24 h; LC3B-II net flux was assessed by subtracting the amount of LC3B-II in the absence of CQ from the amount of LC3B-II in the presence of CQ for each of the conditions; each LC3-II expression level was normalized by its β-actin expression level and the LC3B-II net flux of PA-stimulated cells was normalized to 1; data are expressed as the mean ± SEM of three independent experiments performed in triplicate. (B) Autophagosomes (yellow puncta) and autolysosomes (red puncta) of PA-stimulated HepG2 cells in response to TSF and CQ treatment for 24 h; nuclei were stained with DAPI; bar = 2.5 μm; the number of autophagosomes and autolysosomes per HepG2 cell (n = 30) was counted. (D) BODIPY 493/503-stained intracellular lipid droplets of PA-stimulated HepG2 cells in response to TSF and CQ treatment for 24 h; nuclei were stained with DAPI; fluorescent images and intensity data were collected and assessed using a high-content screening system, bar = 5 μm, data are expressed as the mean ± SEM of three independent experiments performed in triplicate. (E,F) Intracellular triglycerides in PA-stimulated HepG2 cells and primary mouse hepatocytes in response to TSF and CQ treatment for 24 h, data are expressed as the mean ± SEM of three independent experiments performed in triplicate.aP < 0.05, bP < 0.01 vs. BSA group; cP < 0.05, dP < 0.01 vs. PA group; fP < 0.01 vs. PA+TSF group; ∗P < 0.05, ∗∗P < 0.01 vs. PA+CQ group.
