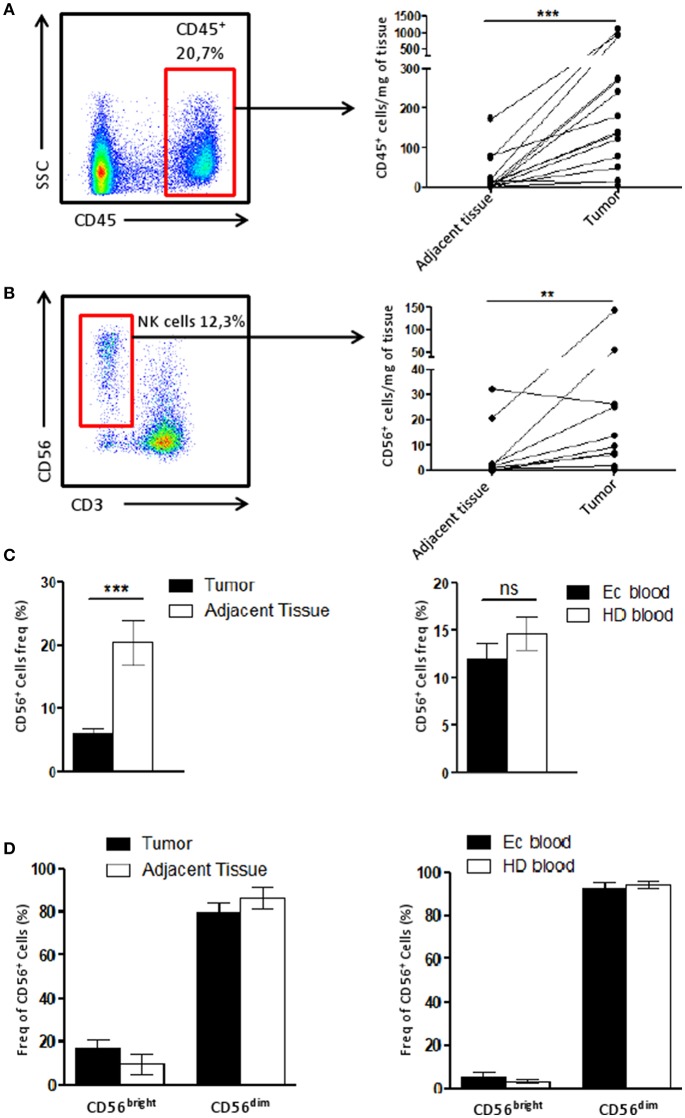
Figure 1.
NK cell infiltrate is altered in the tumor microenvironment. (A) The number of CD45+ cells recovered per mg of either the tumor or the adjacent tissue (n = 15) was plotted here. Briefly, cells were counted by flow cytometry using beads. Each dot-line represents one patient. (B) The number of CD56+ CD3− cells (among CD45+ cells), corresponding to NK cells, recovered per mg of either the tumor or the adjacent tissue (n = 11) was plotted here. Each dot-line represents one patient. (C) On the left panel, the frequency of NK cells (CD56+ cells) among CD45+ cells in the tumor (n = 29), in black, was compared to their frequency in the adjacent tissue (n = 12), in white. On the right panel, the proportion of NK cells among PBMCs from either healthy donors patients [HD blood (n = 13), in white bar] or endometrial cancer patients [EC blood (n = 18), in black bar]. (D) CD56bright and CD56dim cells were identified by flow cytometry among the NK cell population in tissues on the left panel (tumor, n = 13, in black and adjacent tissue, n = 6, in white), and for HD (white bar, n = 7) and EC blood (black bar, n = 4) on the right panel. Mean ± SEM of different patients' samples, **p < 0.01, ***p < 0.001, ns: not significant (p > 0.05).

