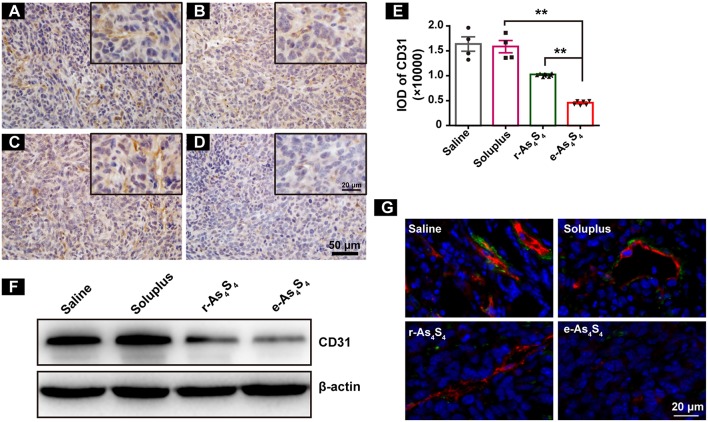
Figure 4.
e-As4S4 down-regulated CD31 in tumor mass. IHC staining of CD31 in tumor tissues of saline (A), soluplus (B), r-As4S4 (C), and e-As4S4 (D). Scale bar = 50 μm (whole image), scale bar = 20 μm (inserted). (E) IOD of CD31 expression of the four groups **p < 0.01. (F) Western blot analysis of CD31 of tumor tissues lysate. (G) Combined staining of CD31 (red) and α-SMA (green) in tumor tissues. Scale bar = 20 μm.

