FIGURE 6.

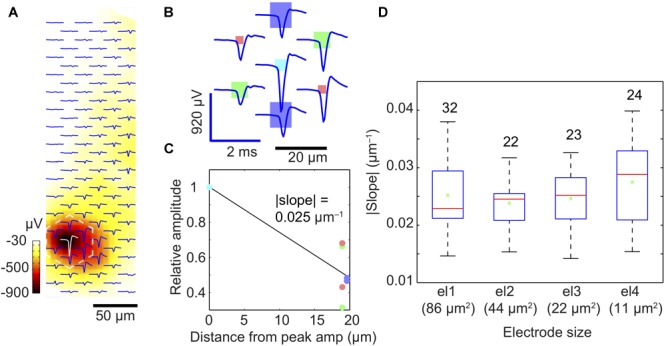
Spatial-averaging of the peak spike amplitude due to electrode size. (A) Exemplary extracellular action potential footprint of a neuron in a dissociated-cell culture, recorded by an electrode array with four different electrode sizes (for the electrode size pattern, see B). The displayed waveforms represent an average of 500 spontaneous spikes. The color bar (dark red to white) indicates the amplitude of the negative peak signals detected by the electrodes. (B) Close-up of the marked area in (A) (dashed white lines) to show the individual waveforms recorded by the electrodes of different sizes (displayed to scale as rectangles: dark blue: 86 μm2; green: 44 μm2; light blue: 22 μm2; red: 11 μm2). (C) Relative amplitudes (relative to the maximum signal at the light blue electrode) recorded at six electrodes surrounding the ‘center electrode’ recording the largest signal per neuronal footprint. The steepness of the slope in (C) reflects the spatial-averaging effect of the central electrode; the steeper the slope, the lower is the spatial-averaging of the central electrode according to its size. The color of each dot corresponds to those of the electrodes in plot (B). (D) Signal averaging results obtained from 101 neurons and shown as a quartile box plot (red line indicates the median, green cross shows the mean, the box edges represent the quartiles, and the whiskers represent the maximum and minimum slopes obtained). The numbers on top of each box/bar indicate the number of measured units or neurons.
