FIGURE 7.

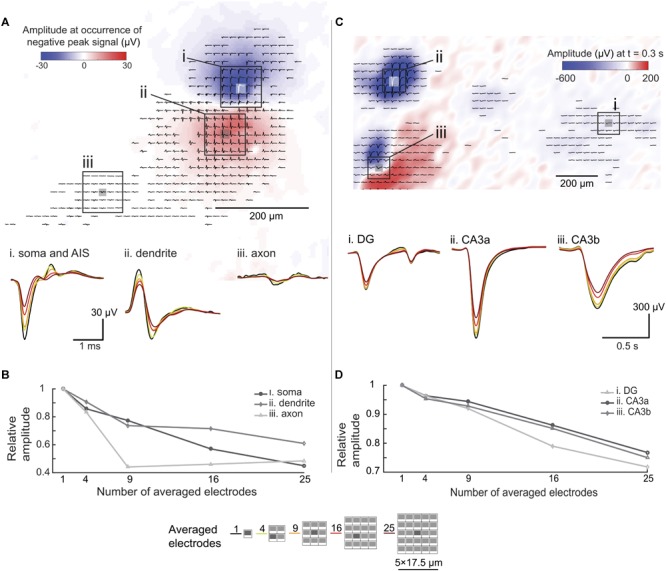
Spatial-averaging of EAPs and LFPs due to electrode size. (A) Extracellular action potential (EAP, bandpass-filtered between 300 Hz to 3 kHz) footprint of a hippocampal neuron (organotypic slice, WT mouse, DIV 17) derived from spontaneous activity. The color map (blue to red) indicates the signal amplitude distribution at the occurrence of the largest negative spike peak in the AIS/somatic region. The waveforms (averaged over 500 trials) show different spike shapes indicating different areas of the neuron. Three areas were chosen for signal averaging assessment: (i) the perisomatic area, (ii) the dendritic area, and (iii) an axonal branch. Waveform changes due to the spatial-averaging are shown at the bottom. The color coding refers to the number of averaged electrodes indicated at the bottom of this figure. (B) Relative peak-to-peak amplitude differences due to the spatial-averaging effects in different areas of the neuron (electrode configurations used for averaging are shown at the bottom of this figure). (C) Local field potential (LFP, bandpass-filtered between 0.1 to 10 Hz) amplitude distribution map, obtained from a single spontaneous event in a hippocampal slice (organotypic culture, WT mouse, DIV 17). The color map (blue to red) indicates the signal amplitude distribution of the LFP 0.3 s after the occurrence of the maximum amplitude signal. The coloring and displayed waveforms (filtered signal detected within 1 s of the recording) indicate different LFP amplitudes and shapes in different areas of the slice. Three areas were chosen for signal spatial-averaging assessment (i) the CA3a area, (ii) the CA3b area, and (iii) the dentate gyrus (DG) area. The displayed waveforms at the bottom show signal alterations upon spatial averaging. Again, the color coding refers to the number of averaged electrodes indicated at the bottom of this figure. (D) Relative peak-to-peak amplitude differences due to the spatial-averaging effects in different areas of the slice (electrode configurations used for averaging are shown at the bottom of this figure).
