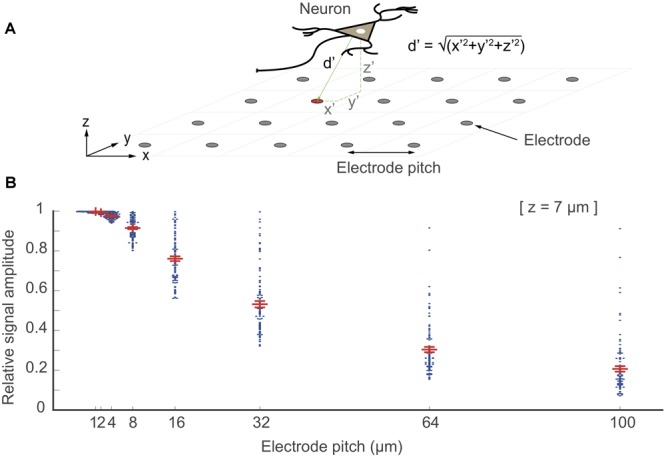
FIGURE 8.

“Electrode being at the right spot”. In this simulation, point electrodes were arranged as an array within 1 × 1 mm2 of space at different electrode pitch configurations. 100 point-current sources were placed randomly above the array at a z-distance at 7 μm (one neuron as a source is shown in the top figure). The relative signal amplitude, acquired by the electrodes, depended on the distance (d′ = √(x′2+ y′2+ z′2) of the electrodes to each of these point-current sources (located at x′y′z′). The largest signal amplitudes of each given signal source that have been picked up by the electrodes are plotted as points for each electrode-pitch array configuration. The signal amplitudes were normalized with respect to the largest signal amplitude recorded by a given electrode for all configurations.
