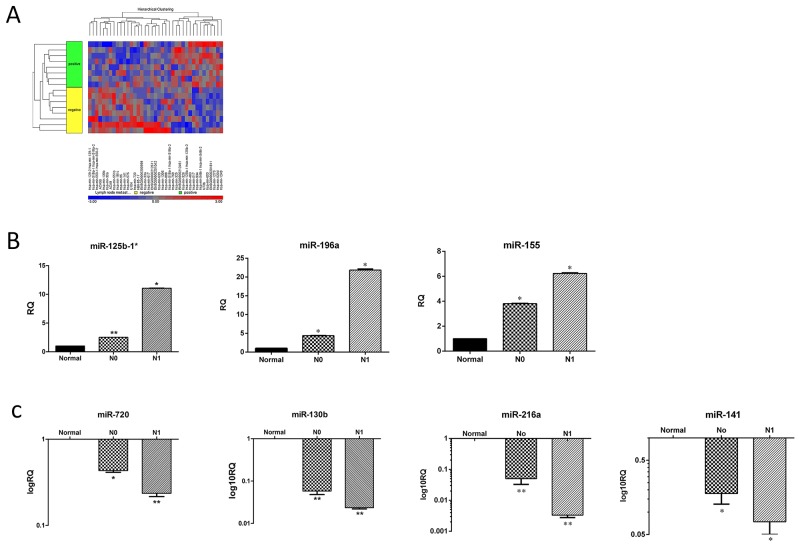
Figure 1. miRNA expression pattern in N1 and N0 PDAC samples.
(A) Affymetrix microarray hierarchical clustering performed on miRNA of LN positive (N1) compared to LN negative (N0) PDAC samples (p<0.05). A colored bar indicating the standardized log2 intensities accompanies the expression profile. (B) qRT-PCR validation of the expression levels of three representative up regulated miRNA: hsa-miR-125-b*, hsa-miR-196a, hsa-miR-155. (C) qRT-PCR validation of the expression levels of four representative down regulated miRNA: hsa-miR-720, hsa-miR-130b, hsa-miR-216a and hsa-miR-141 from the indicated groups: Normal, N0 and N1. Each histogram represents the average of 8 samples as indicated in materials and methods (n=8). *P <0.05; **P < 0.01; ***P <.0001.

